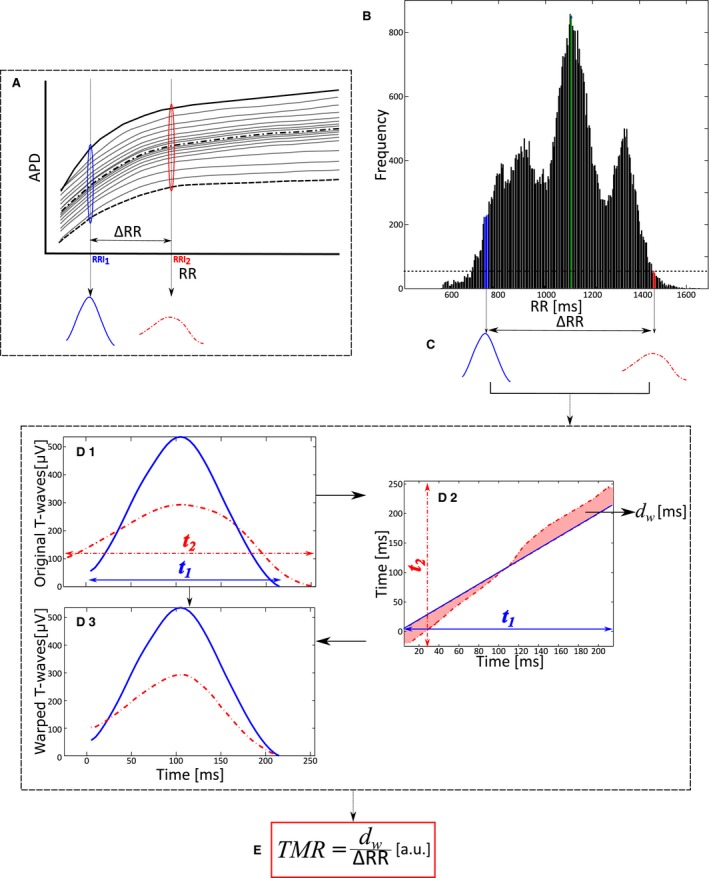
Figure 1.

Quantification of the T‐wave morphology restitution index. A, Diagram illustrating the hypothesis underlying the proposed methodology: changes in the dispersion of repolarization with RR are reflected as a variation in the morphology of the T‐wave with RR. B, RR histogram with bins of RR=10 milliseconds. The green bin shows the median RR interval value. Blue and red bins indicate the RR values defining the maximum intrasubject range. C, Mean warped T‐waves of those T‐waves associated with the RR values selected in (B). D, Calculation of the index of T‐wave morphological difference, d w, computed by time‐warping both mean warped T‐waves. E, The index of T‐wave morphology restitution, TMR, is calculated as d w, normalized by the difference between the RR values of both bins, ΔRR. a.u. indicates adimensional units.
