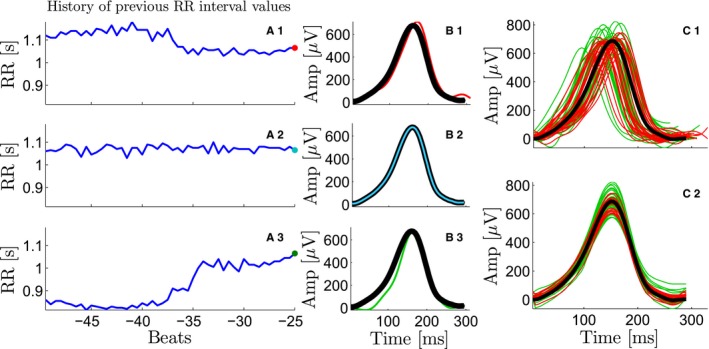
Figure 2.

Compensation for the T‐wave morphology rate dependence. A1‐A3, Three different RR interval (RRI) series previous to a beat with the same RRI. From A1 to A3 the RRI tendency is decreasing, stable, and increasing, respectively. B1‐B3, The T‐wave for each current beat (in red, cyan, and green, respectively), which depends on the history of previous RRI values. The mean warped T‐wave is superimposed and plotted in black. C1‐C2, The mean warped T‐wave (black), used later for T‐wave morphology restitution estimation, compensates for the different histories of RR of each T‐wave in the bin. C1, The mean warped T‐wave (black) and 50 T‐waves from a particular RR bin, where the previous RRI values were longer (red) and shorter (green), respectively, than the current RRI. C2, The mean warped T‐wave (black) and the 50 individual T‐waves after being warped with respect to the mean warped T‐wave.
