
Figure 3.
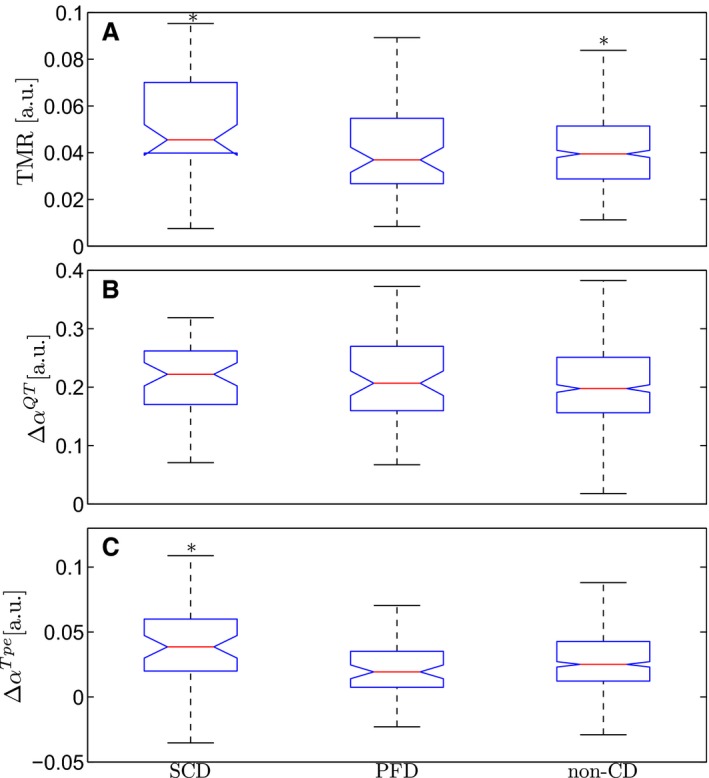
Box plots of T‐wave morphology restitution, TMR, (A) and slopes of the regressions of the QT, ΔαQT (B) and Tpe, ΔαTpe (C) intervals for the 3 outcomes: sudden cardiac death (SCD), pump failure death (PFD), and noncardiac death (CD) victims. *Indicates significant differences with respect to the group of patients with the other 2 outcomes.