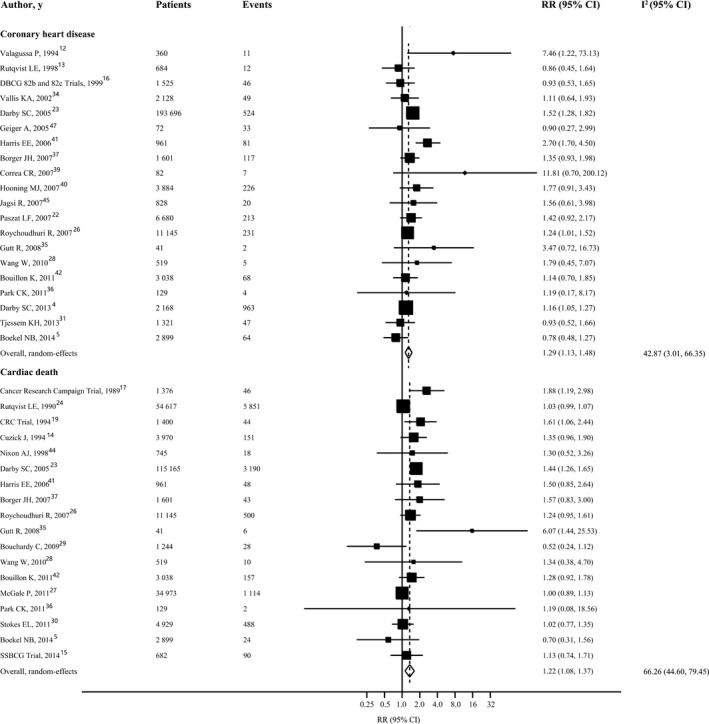
Figure 1.

Forest plot for risk of coronary heart disease and cardiac mortality in patients with left‐sided radiotherapy vs those with right‐sided radiotherapy. The size of each square is proportional to the study's weight (inverse of variance). I2 indicates variation in RR attributable to heterogeneity; RR, relative risk.
