
Figure 2.
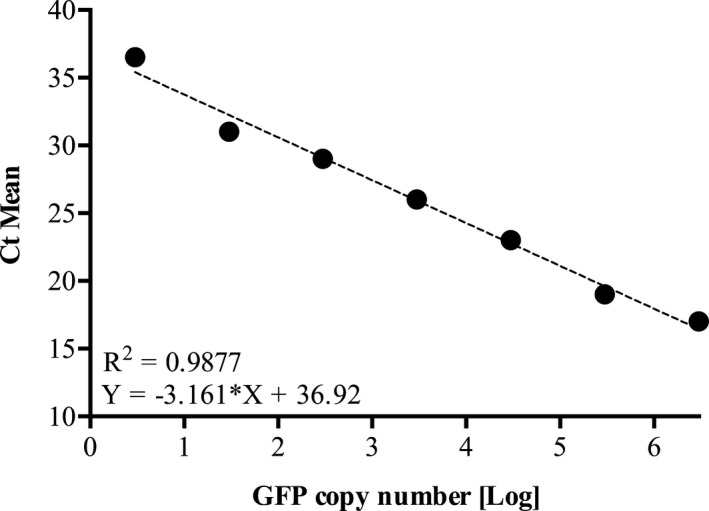
Linear regression of standard curve obtained from serial dilutions of the pLenti6.2‐GW/EmGFP plasmid (3—3×10⁶ copy number) assayed in duplicate by qPCR. R 2 and equation of linear regression are described in the intersection point of the chart. Ct indicates threshold cycle; GFP, green fluorescent protein; qPCR, quantitative real‐time polymerase chain reaction.