
Figure 3.
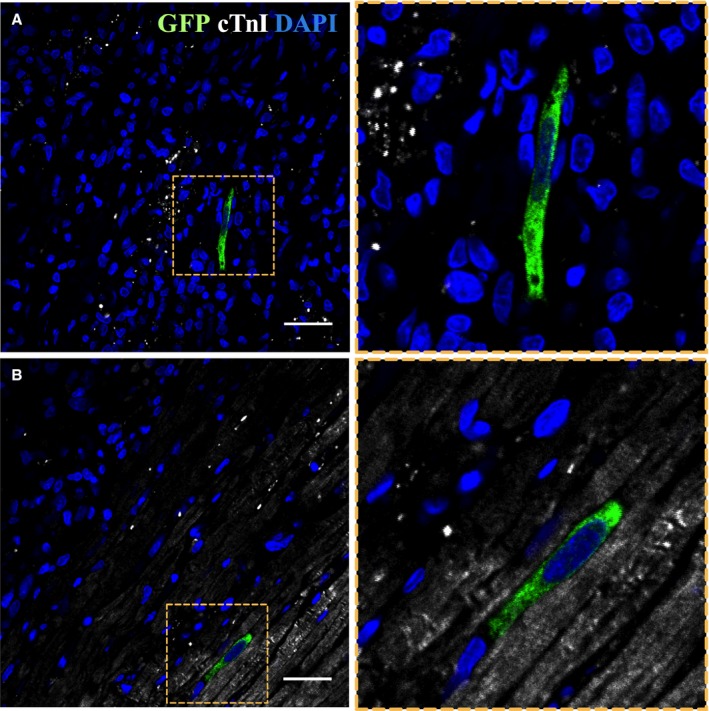
ATMSCs implantation in the myocardium. Confocal microscopy images showing GFP‐positive ATMSCs (green) in the infarct area (A) and border zone (B) (cTnI in white and nuclei counterstained with DAPI in blue). Right panels represent zoom images from the left panels. Scale bars, 50 μm. ATMSCs indicates adipose tissue‐derived mesenchymal stem cells; cTnI, cardiac troponin‐I; DAPI, 4′,6‐diamidino‐2‐phenylindole dihydrochloride; GFP, green fluorescent protein.