
Figure 4.
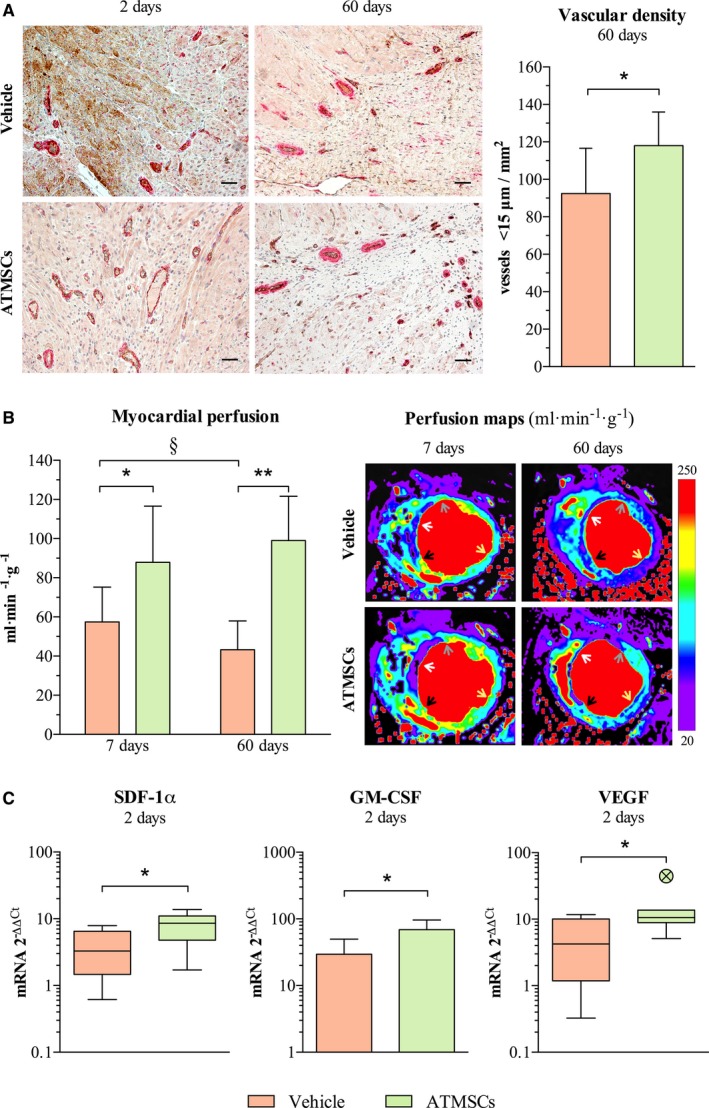
Effects of ATMSCs therapy on myocardial vascularization and perfusion. A, Microphotographs on the left (endothelial cells stained in brown and smooth muscle cells stained in red) and bar chart on the right showing increased vessel density in the border infarct zone of animals receiving cell therapy. B, Bar chart on the left and cardiac magnetic resonance images (myocardial quantitative perfusion maps) on the right illustrate an enhancement on myocardial perfusion of infarct border zone in animals receiving allogeneic ATMSCs. Arrows point to perfusion analysis region of interest (gray, anterior infarct border; white, core infarcted area; black, septum infarct border; yellow, posterior remote myocardium). C, Charts show up‐regulation of the pro‐angiogenic mediators SDF‐1α, GM‐CSF, and VEGF in the infarcted tissue of the ATMSCs group compared with vehicle group, as assessed by qPCR. *P<0.05 between groups; **P<0.01 between groups; § P<0.05 paired t test. Scale bars, 50 μm. ATMSCs indicates adipose tissue‐derived mesenchymal stem cells; GM‐CSF, granulocyte‐macrophage colony‐stimulating factor; qPCR, quantitative real‐time polymerase chain reaction; SDF‐1α, stromal‐derived factor 1α; VEGF, vascular endothelial growth factor.