
Figure 7.
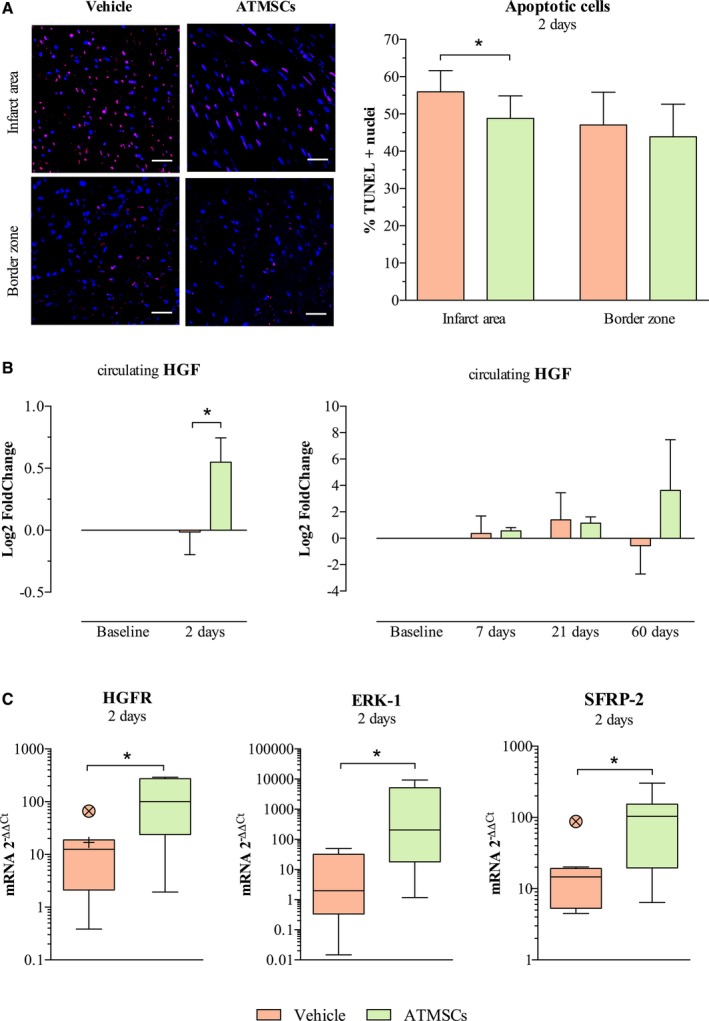
Analysis of apoptotic process. A, On the left, images from immunofluorescent staining (TUNEL‐positive nuclei stained in magenta and total nuclei counterstained with DAPI in blue) and on the right, bar chart comparing study groups' percentage of apoptotic cells in the infarcted tissue and border infarct zone at 2 days post‐AMI. B, Bar chart on the left showing an increase in the anti‐apoptotic mediator HGF in serum of ATMSCs‐treated animals, as measured by ELISA technique. Bar charts on the right show similar dynamics of HGF in the long‐term follow‐up groups. C, Box plots represent gene expression by qPCR of HGFR and ERK‐1, mediators of HGF signaling pathway, and the anti‐apoptotic SFRP‐2 up‐regulation in infarcted tissue of ATMSCs group animals. *P<0.05 between groups. Scale bars, 50 μm. ATMSCs indicates adipose tissue‐derived mesenchymal stem cells; AMI, acute myocardial infarction; DAPI, 4′,6‐diamidino‐2‐phenylindole dihydrochloride; ERK‐1, extracellular signal–regulated kinase 1; HGF, hepatocyte growth factor; HGFR, hepatocyte growth factor receptor; qPCR, quantitative real‐time polymerase chain reaction; SFRP‐2, secreted frizzled‐related protein 2; TUNEL, terminal deoxynucleotidyl transferase (TdT)‐mediated dUTP nick‐end‐labeling.