
Figure 8.
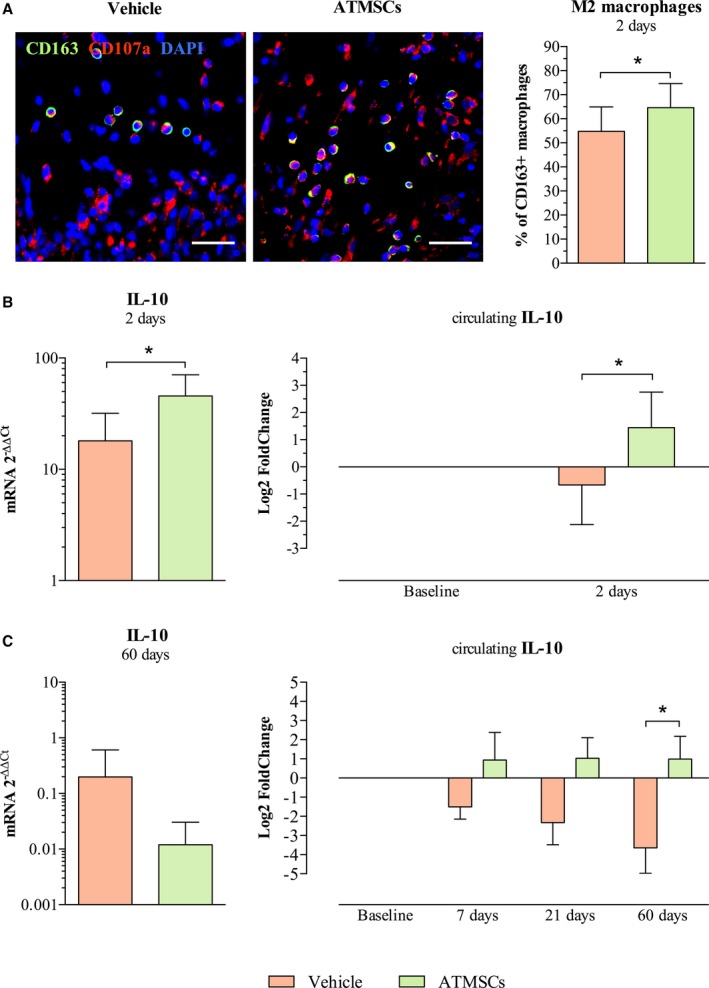
ATMSCs modulatory properties on inflammatory response. A, Microphotographs on the left show macrophages (CD107a‐positive cells in red) and the M2 macrophages subset (CD163‐positive and CD107a‐positive cells, double stained in green and red) in the infarct zone. Bar chart, on the right, shows higher percentage of M2 macrophages with respect to total macrophages in ATMSCs group compared with vehicle. B, Anti‐inflammatory IL‐10 was found up‐regulated in the infarcted tissue by qPCR (bar chart on the left) and increased in serum by ELISA (bar chart on the right) in animals receiving ATMSCs, compared with vehicle‐treated at 2 days post‐AMI. C, Bar chart on the left shows IL‐10 gene expression assessed by qPCR in the long‐term follow‐up groups. The study of circulating IL‐10 showed similar dynamics at 7‐ and 21‐day follow‐up in both study groups; however, a significant increase of IL‐10 in serum was detected at 60 days post‐AMI in ATMSCs‐treated animals compared with controls (bar charts on the right). *P<0.05 between groups. Scale bars, 20 μm. ATMSCs indicates adipose tissue‐derived mesenchymal stem cells; DAPI, 4′,6‐diamidino‐2‐phenylindole dihydrochloride; IL‐10, interleukin‐10; qPCR, quantitative real‐time polymerase chain reaction.