
Figure 2.
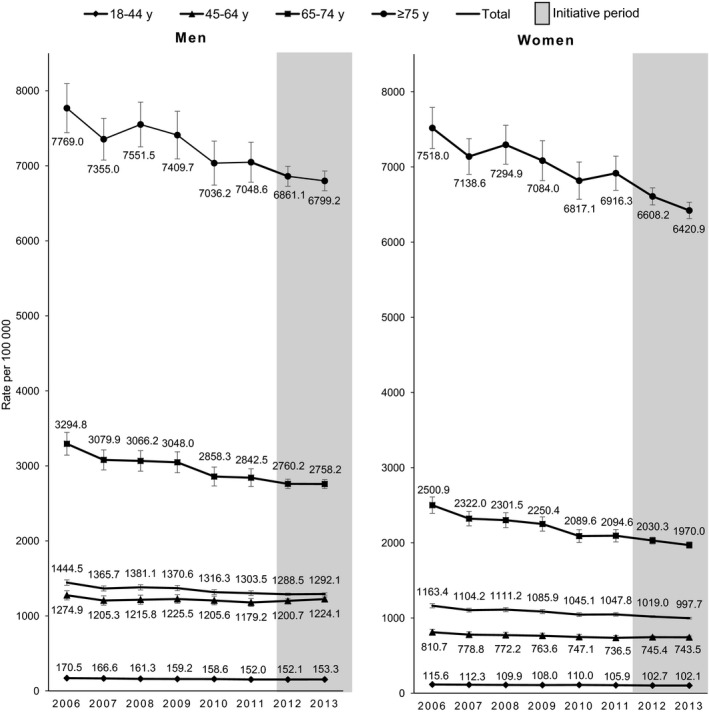
Million Hearts event rates before and during the Million Hearts initiative, by sex and age group, 2006–2013. Total rates were standardized by age to the 2010 US population. Bars denote 95% confidence intervals for the rates.
Official websites use .gov
A
.gov website belongs to an official
government organization in the United States.
Secure .gov websites use HTTPS
A lock (
) or https:// means you've safely
connected to the .gov website. Share sensitive
information only on official, secure websites.
Million Hearts event rates before and during the Million Hearts initiative, by sex and age group, 2006–2013. Total rates were standardized by age to the 2010 US population. Bars denote 95% confidence intervals for the rates.