
Figure 3.
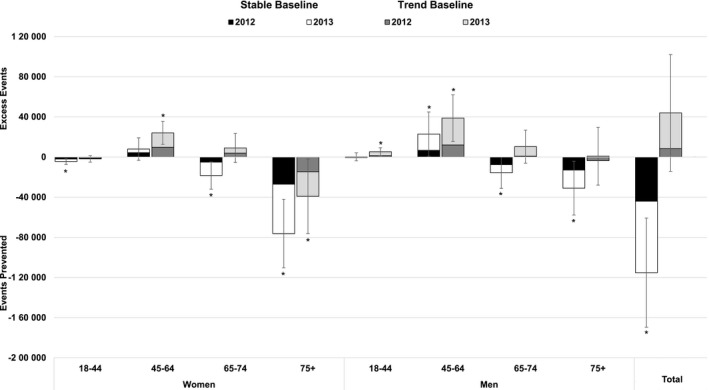
Estimated number of mutually exclusive Million Hearts events prevented in 2012 and 2013, by baseline strategy, sex, and age group. Determined by combining the observed event totals from the 2012 and 2013 and subtracting the expected number of events calculated by multiplying the 2011 modeled sex‐ and age‐specific rates (stable baselines) or by applying the annual percent change to the modeled 2011 rate for each sex‐ and age‐specific group to generate expected 2012 and 2013 rates (trend baselines) and multiplying those rates by the US Census mid‐year population estimates for 2012 and 2013, respectively. During 2012–2013, 115 210 (95% CI, 60 858, 169 562) events were prevented using the stable baseline; an excess of 43 934 (95% CI, −14 264, 102 132) events occurred using the trend baseline. Bars denote the 95% confidence intervals. Values denoted with an asterisk (“*”) are statistically significantly different than 0 (z‐score ≥|1.96|). Table S2 includes the sex‐ and age‐specific values for each year and for 2012 and 2013 combined.