Figure 3.

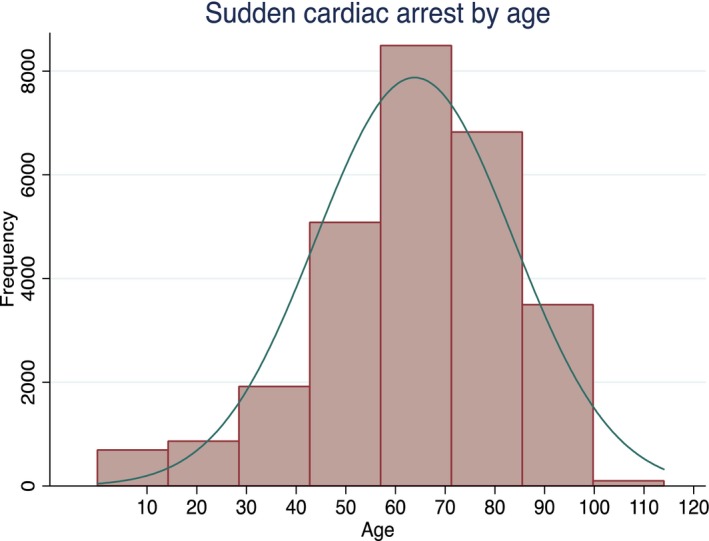
Histogram displaying the frequency of SCA events by victim age using data from the US Resuscitation Outcomes Consortium Epistry data registry (2011–2015).

Histogram displaying the frequency of SCA events by victim age using data from the US Resuscitation Outcomes Consortium Epistry data registry (2011–2015).