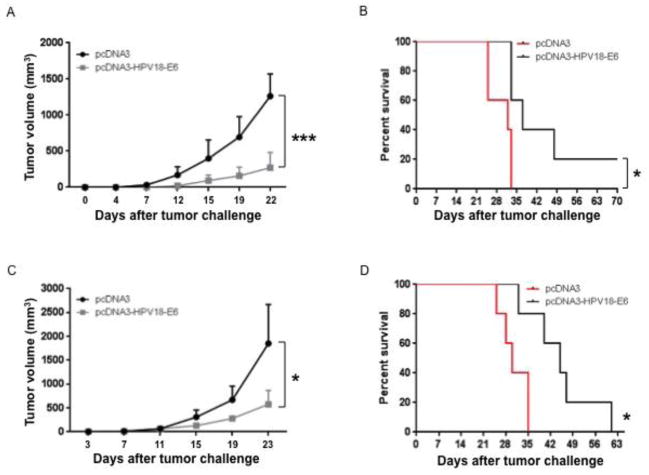
Figure 5. Characterization of antitumor immunity generated by pcDNA3-HPV18-E6 DNA vaccine.
(A-B) To test whether the immune responses generated by pcDNA3-HPV18-E6 DNA vaccine could prevent TC-1/HPV18-E6 tumor growth, 5 ~ 8 weeks old female C57BL/6 mice (5 mice/group) were immunized with either 50 μg/mouse of pcDNA3-HBV18-E6 or empty pcDNA3 vector control through IM injection followed by electroporation three times with 1-week interval. The mice were challenged subcutaneously with 1 × 10⁵/mouse of TC-1/HPV18-E6 cells one week after the last vaccination. Tumor growth was monitored by measurement with a digital caliper twice a week. Survival of the mice was monitored every other day. A. Line graph showing TC-1/HPV18-E6 tumor growth curve. B. Survival curve of TC-1/HPV18-E6 tumor-bearing mice. (C-D) To test whether the immune responses generated by pcDNA3-HPV18-E6 DNA vaccine could demonstrate therapeutic effect in TC-1/HPV18-E6 tumor-bearing mice, 5 ~ 8 weeks old female C57BL/6 mice (5 mice/group) were challenged subcutaneously with 7.5 × 10⁴/mouse of TC-1/HPV18-E6 tumor cells. On day 3, the mice were immunized with either 50 μg/mouse of pcDNA3-HPV18-E6, or pcDNA3 through IM injection followed by electroporation three times with 4-day interval. Tumor growth was monitored by measurement with a digital caliper twice a week. Survival of the mice was monitored every other day. C. Line graph showing TC-1/HPV18-E6 tumor growth curve. D. Survival curve of TC-1/HPV18-E6 tumor-bearing mice. Data are represented as mean ± SD. p-values were calculated by 2-tailed Student’s t test or log rank test. * = p<0.05; *** = p<0.001.

