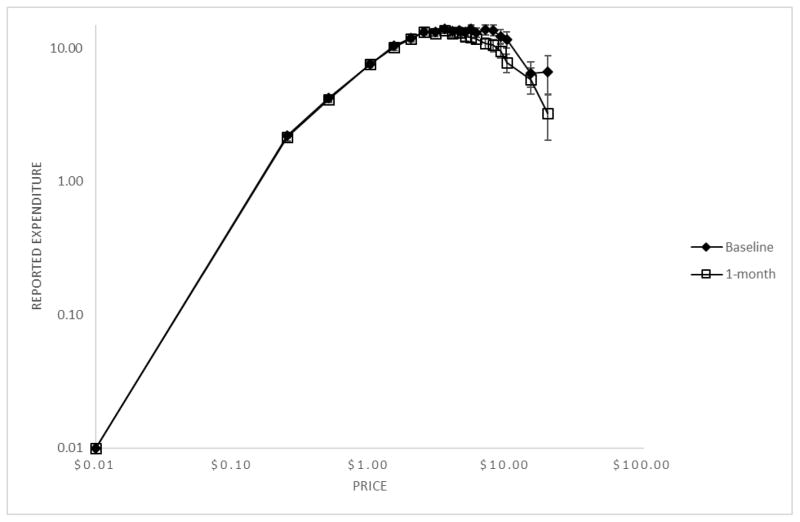
Figure 2.
Demand curve for expenditure of standard alcoholic drinks at baseline and 1-month. Expenditure is calculated by multiplying price by consumption. The x-axis is log-transformed expenditure in dollars and the y-axis is the log-transformed self-reported expenditure. Each data point represents the sample mean for each individual expenditure point; error bars represent the standard error of the mean.

