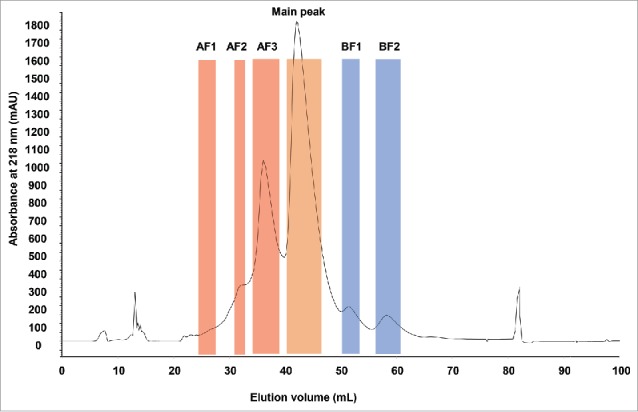
Figure 1.

CEX UV chromatogram of stressed monoclonal IgG1 antibody. The boundaries of the collected fractions are indicated by colored areas. AF: acidic fractions in red. BF: basic fractions in blue. Main peak is highlighted in orange. UV absorbance in mAU was measured at 218 nm. Elution volume is indicated in mL.
