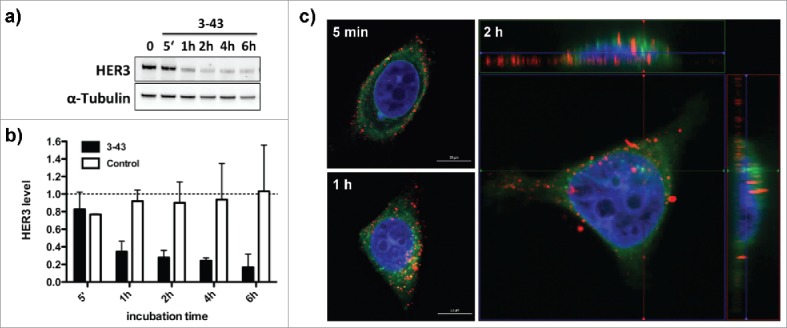
Figure 4.

Internalization of IgG 3–43. (a) Cellular HER3 expression levels after incubation of MCF-7 cells with IgG 3–43 (100 nM) analyzed by immunoblotting. (b) Quantification of HER3 levels after incubation with IgG 3–43 or an irrelevant control antibody for the indicated time points. HER3 levels were analyzed by western blot. (c) Confocal fluorescence analysis of MCF-7 cells incubated with Cy5-labeled IgG 3–43 (red) for the indicated time points. Cells were counter-stained with DAPI (blue) and Con-A (green).
