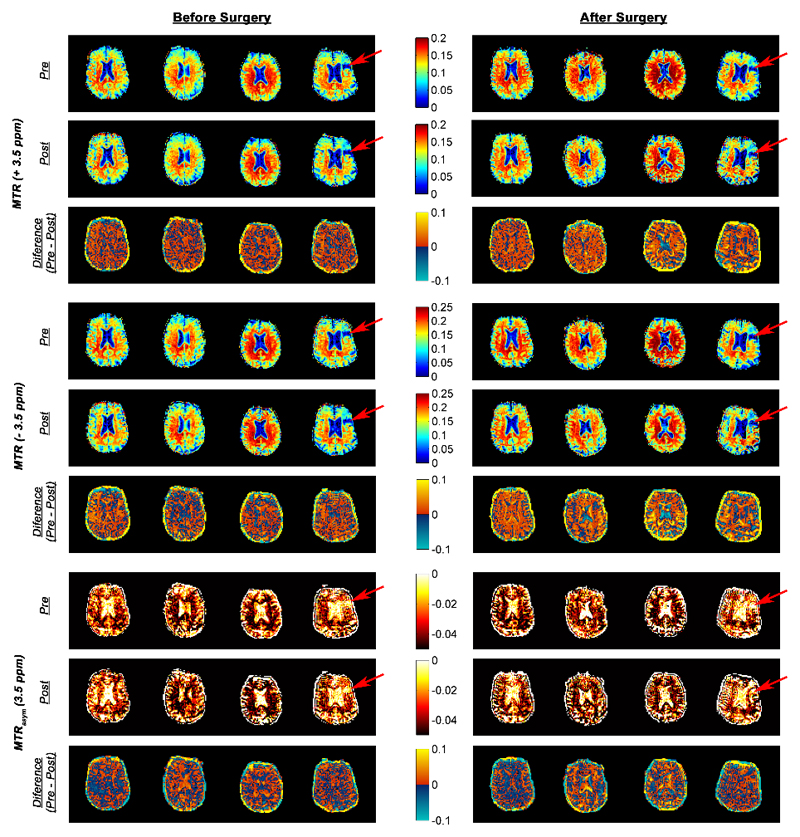
Figure 3.
Pre- and post-contrast MTR (± 3.5 ppm) and MTRasym (3.5 ppm) of each patient before and after surgery. The difference of MTRs and MTRasym pre- and post-Gd administration were plotted directly below their respective pre-images. The red arrows show a prior infarct in patient 4 (cross-checked with DWI data and found CSF-like signal in the area).

