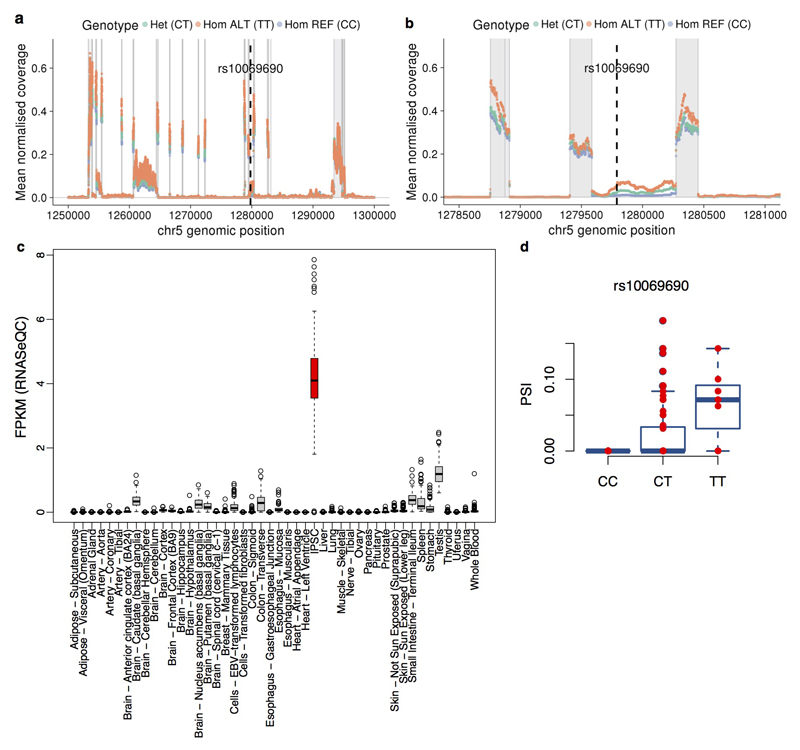
Extended Data Figure 10. Tissue expression and alternative splicing results at the TERT locus.
(a,b) Normalised RNA-seq per-base coverage across the TERT locus stratified by rs10069690 genotype. Plotted in the full locus (a), while (b) shows a zoomed view of the region around the lead eQTL and cancer risk variant rs10069690, indicated with a dotted line on each plot. Grey regions indicate annotated exons from Ensembl v75. Coverage was computed from indexed BAM files using the coverageBed function from the bedtools (v2.25.0) 92. Raw coverage was divided by total library size in millions (total number of mapped reads) per sample to obtain normalised coverage, which was then averaged over samples with the same rs10069690 genotype to obtain mean normalised coverage for each genotype group. (c) Profile of TERT expression in iPSCs and across somatic tissues from GTEx. Shown are gene FPKM values obtained with RNA-SeQC (GTEx V6p). (d) Splicing-QTL of TERT. We quantified TERT intron retention rates using Leafcutter {Li, 2016 #443} and identified one alternative splicing event associated with rs10069690, the lead iPSC eQTL variant for TERT (Fig. 5b). Shown is TERT intron 4 retention ratio (PSI, percent spliced in) in iPSC lines of all individual donors stratified by their genotype at rs10069690. This variant affects the splicing of the intron where it is located, with the minor allele (T) increasing the fraction of TERT transcripts in which intron 4 is retained (P = 1.7x10⁻⁹, Bonferroni adjusted linear regression).

