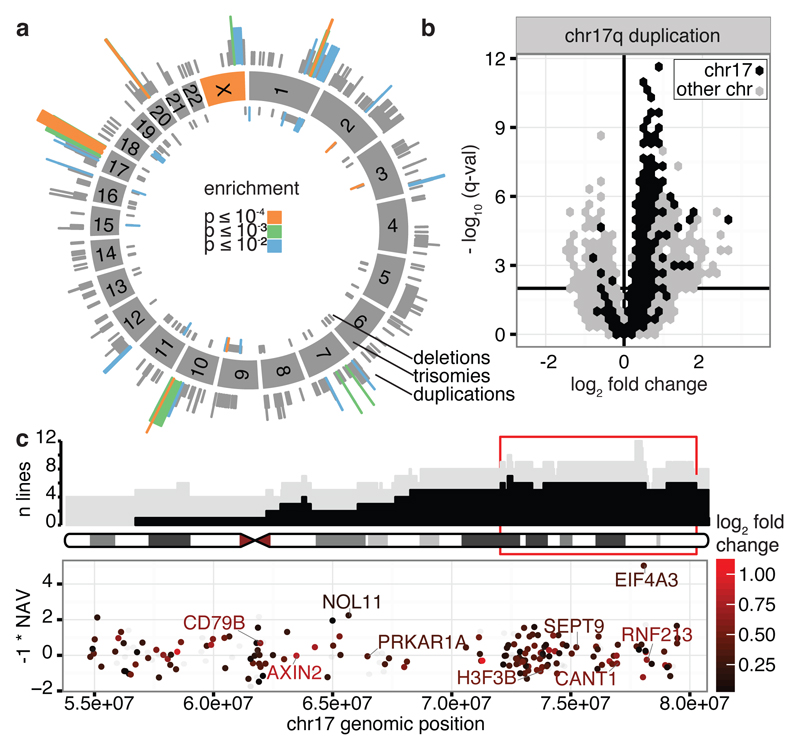
Figure 2. Locations and consequences of recurrent CNA regions.
(a) Genomic locations of CNAs. Colours denote the significance level of recurrence. (b) Genes differentially expressed between lines with CN 2 and 3 for the recurrent chr17 CNA. Horizontal bar denotes 1% FDR threshold (Benjamini-Hochberg). (c) Top panel shows genomic location versus number of lines with CN 3 (grey) and with a CNA (black). Bottom panel shows the NAV gene score from ref22 and log2 gene expression fold change between the iPSC lines with CN 2 and 3 (color scale), in the region highlighted in red in the top panel. Highlighted genes are up-regulated when copy number increases, known onco/tumour-suppressor genes and/or genes with NAV score in the top 2%.

