Figure 5.
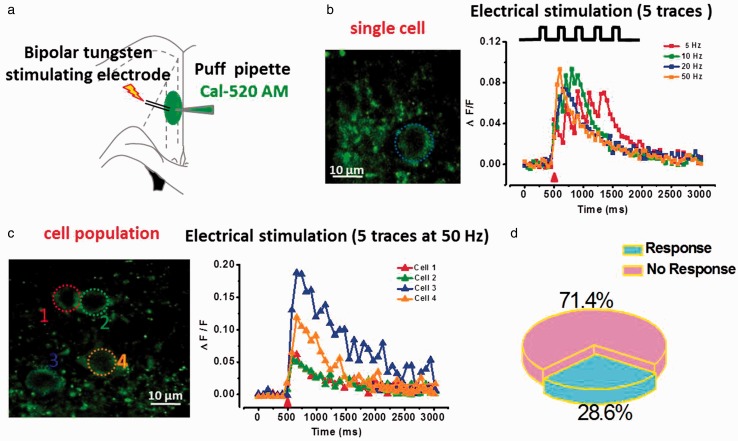
Repetitive electrical stimulation evoked Ca2+ signals in cell population after bolus loading of Cal-520 AM in ACC pyramidal neurons. (a) Schematic diagram showing the placement of stimulating electrode and puffing pipette in the layer II/III pyramidal neurons of ACC. (b) Left: two-photon fluorescent image of puff-application of calcium indicator Cal-520 AM (200 µM). The blue dash circle indicates the position of the frame scan: Right, waveforms of fluorescence changes (ΔF/F) in response to five traces at 5, 10, 20, and 50 Hz in single cell. (c) Left: representative fluorescent image of cell population showing the soma of active neurons. Right: waveforms of fluorescence changes (ΔF/F) in response to five traces at 50 Hz in four active cells. (d) Pie graph summarizing the active ratio of evoked Ca2+ signals in cell population (n = 42) after five traces at 50 Hz electrical stimulation.

