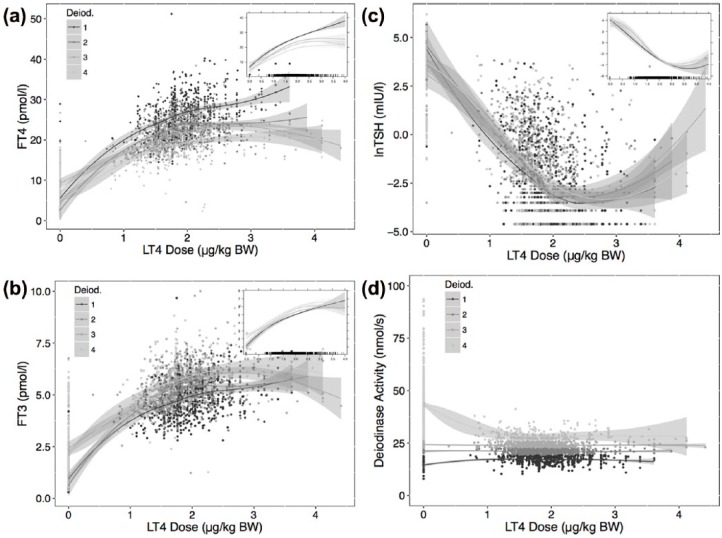
Figure 1.
Relationships between FT4 (a), FT3 (b), and TSH (c) and weight-adjusted LT4 dose, stratified by quartiles of deiodinase activity. The main panels show crude relationships obtained by locally weighted scatterplot smoothing in each strata. The inserts are derived by a linear mixed model (see Methods), fitting natural splines to the interaction of deiodinase activity with LT4 dose. The interaction term was significant (p < 0.001) for all relationships, indicating a change in slope, not a strictly parallel shift. The distribution of the deiodinase strata is shown in (d). The shaded area surrounding the curves indicates 95% confidence interval in this and other figures.
FT3, free triiodothyronine; FT4, free thyroxine; LT4, levothyroxine; TSH, thyroid stimulating hormone; BW, body weight.

