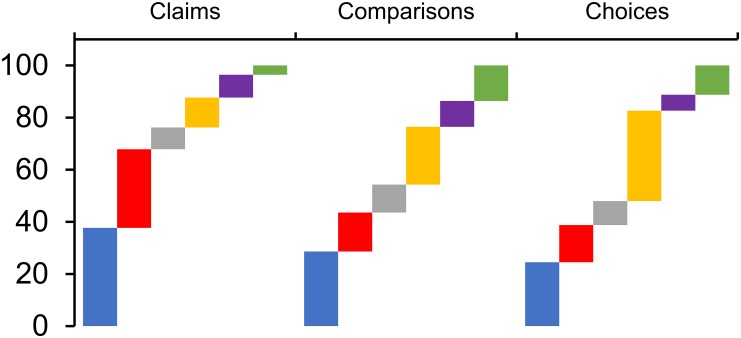
Fig 2. Graph to show the proportion of resources that are of each format in the CARL database.
Vertical axis is percentage of total resources of the specified target users. Horizontal represents the Key Concept group in question. (Blue) Text. (Red) Audio. (Grey) Videos. (Yellow) Websites. (Purple) Cartoons. (Green) Lessons.

