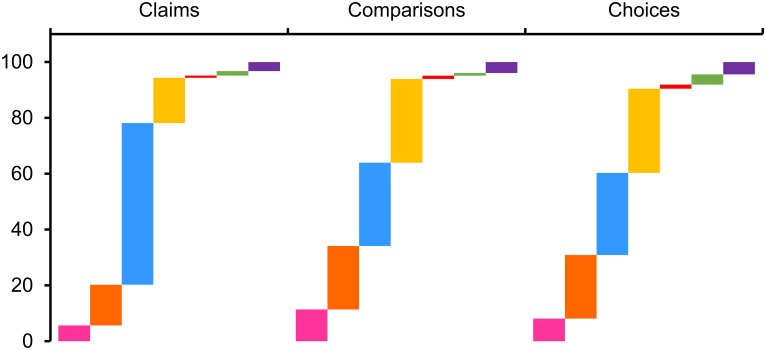
Fig 3. Graph to show the proportion of resources that are targeted at each Target User group in the CARL database by each of the Key Concept groups.
Vertical axis is percentage of resources in a group. Horizontal is the Key Concept group in question. (Pink) Teachers of school age children. (Orange) Teachers of students in further education. (Light blue) Independent learners with general interests. (Yellow) Higher level learners, such as those in further education or with higher level knowledge. (Red) Advisors, e.g. policymakers. (Green) Communicators, e.g. journalists. (Purple) Researchers interested in developing educational resources.

