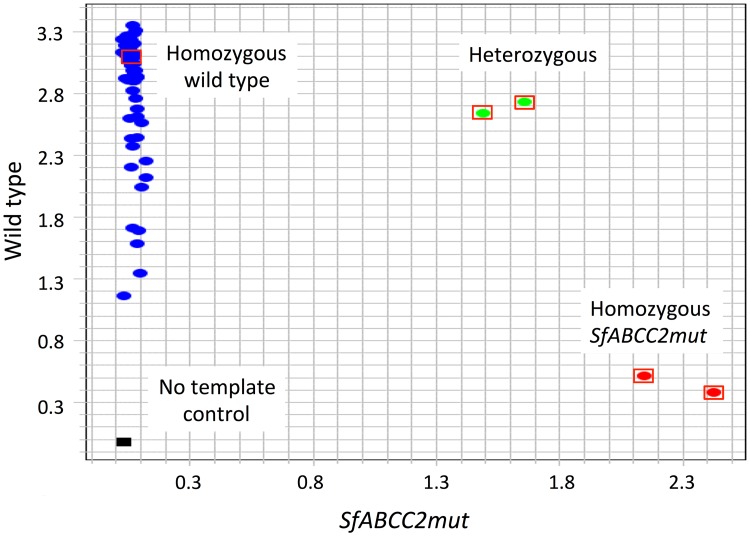
Fig 6. Allelic discrimination plot demonstrating the absence in the Togo collections of the SfABCC2mut allele associated with resistance to the Cry1Fa Bt toxin.
Real-time PCR assays were performed using primers specific to either the SfABCC2mut allele or the non-mutant (wildtype) allele, with each primer tagged with a different fluorescent label. The relative levels of the SfABCC2mut fluorescent signal for each sample were plotted on the X-axis and the wildtype signal on the Y-axis. Homozygous SfABCC2mut samples (red dots) show relatively high X and low Y values. Homozygous wildtype samples (blue dots) show the converse, relatively low X and high Y values. Heterozygotes (green dots) have intermediate values. Laboratory controls for each genotype are indicated by oval with a red rectangle border. All Togo specimens (ovals with no rectangle) had low X and high Y signal. The no template control is given by the black box near the origin indicating absence of signal from either primer.

