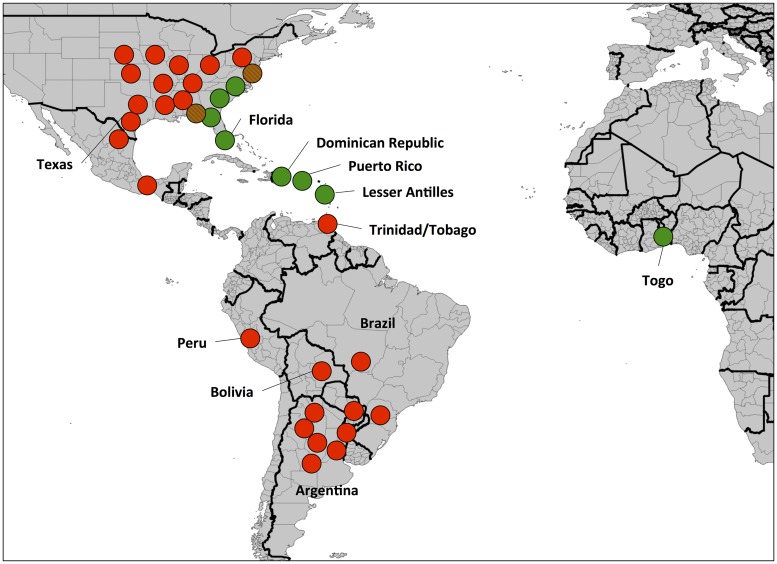
Fig 7. Map showing the distribution of the haplotype ratio metric in the Western Hemisphere (derived from [38]) and Togo.
Circles approximate locations were fall armyworm surveys were performed with color indicating the haplotype metric found. Green circles, FL-type; red, TX-type; red and green, FAW[M] mixed profile.

