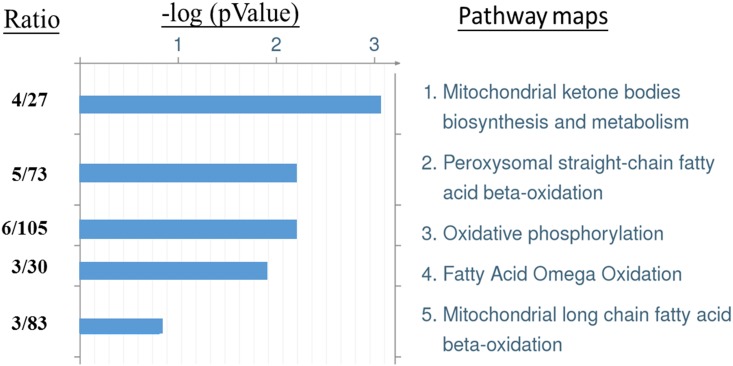
Fig 5. Top 5 significant pathway maps regulated by T1DM and AFB1.
The differential-expressed proteins were selected for MetaCore pathway analysis. The statistical tools (-log P, P value) evaluate relative connectivity of proteins of different functions. The ratio indicates the number of matched proteins from the differential expressed proteins to the number of expected proteins of whole database associated with the respective pathway.

