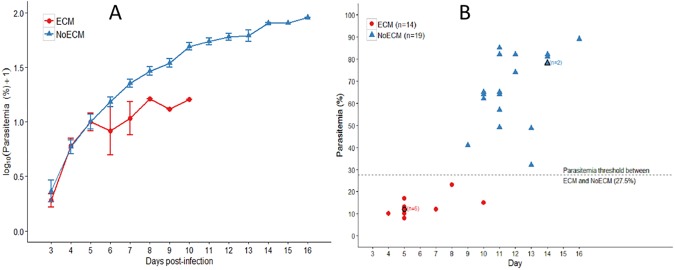
Fig 2. Parasitemia analysis.
A) Parasitemia (Log%+1) in Sprague Dawley rats infected by K173. Young SD rats 4.5 weeks old were infected with 5.107 parasitized mouse erythrocytes by ip injection. Parasitemia determined from Giemsa stained tail blood smears was monitored from day 3 pi. Parasitemia in ECM and NoECM is presented versus days post-infection. Parasitemia is expressed in mean ± standard error (SEM). B) Distribution of ECM (n = 14) and NoECM (n = 19) rats versus parasitemia at the day of the death. Some rats died very early on the morning and their last reported parasitemia dated from the previous evening explaining why some points have one-day difference between Fig 1 and Fig 2B. There was no overlap of the two populations leading to a parasitemia threshold of 27.5% being established allowing the prediction that over this value all infected rats will not display a CM event but severe anemia.

