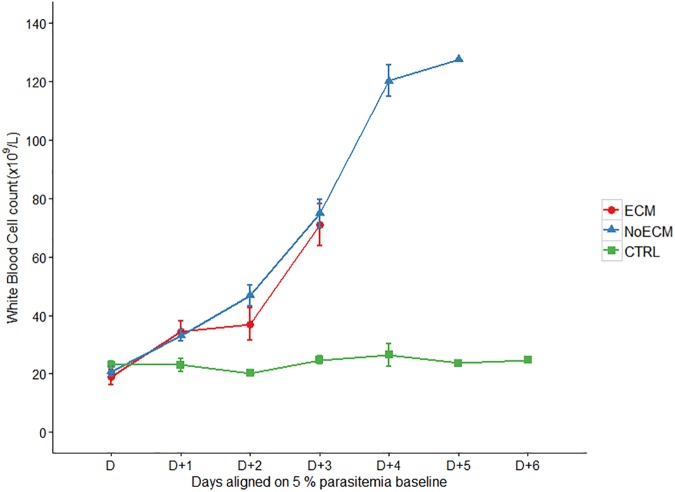
Fig 6. White blood cell count during the course of infection in ECM (n = 17), NoECM (n = 22) and control (n = 13) groups.
Parameters are aligned from and on the basis of the day (D) where parasitemia was estimated at 5% (S1B Fig). All data are represented by the mean ± standard error of the mean (SEM).

