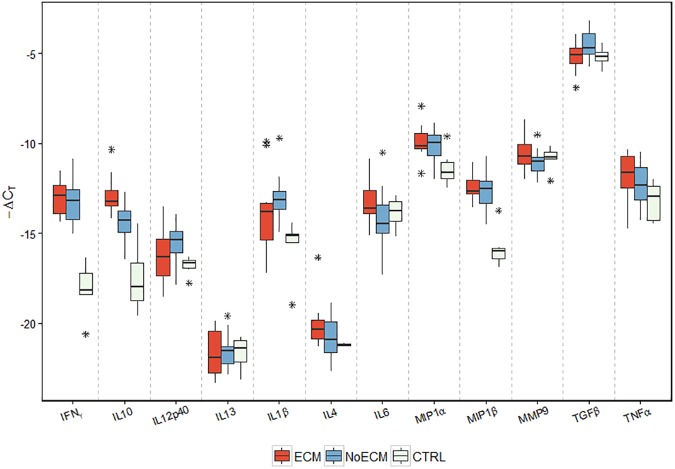
Fig 8. Expression of cytokines in SD rat brains infected by K173.
Cerebral cytokine gene expression was assessed in ECM (n = 14), NoECM (n = 23) and Control brains (n = 7). Samples were collected on day ECM onset for ECM rats, after the parasitemia reached 30% for NoECM rats and for control rats at the same time as ECM and NoECM groups. Box plots represent medians and 25th and 75th percentiles. Among all the cytokines investigated only the gene expression of INFγ (p<0.001), IL10 (p<0.001), IL1β (p = 0.001), TNFα (p = 0.045), MIP1α (p<0.014) and MIP1β (p<0.001) were significantly different between infected and control rats. The symbol * indicates outliers.

