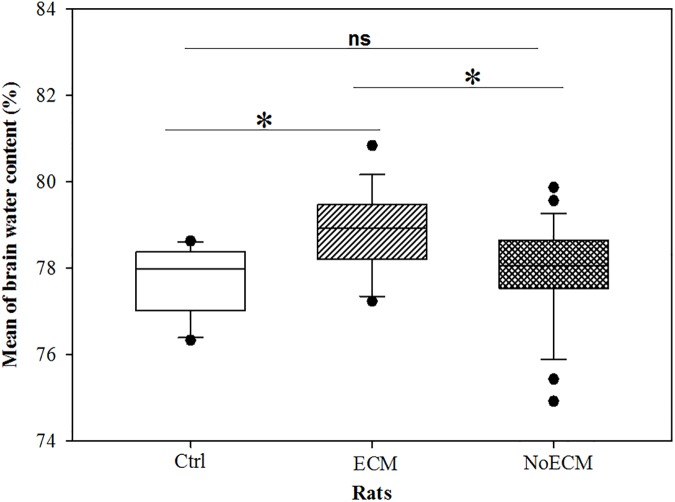
Fig 9. Edema test.
Quantification of water contained in brains of ECM (n = 12), NoECM (n = 13) and Control brains (n = 8). The brain water content in the ECM group was statistically higher than that in NoECM (p = 0.007) and Control rats (p = 0.02). The p value was not significant (ns) between NoECM and Control rats (p = 0.66). Box plots represent medians and 25th and 75th percentiles. Statistical test used: Kruskal-Wallis One Way Analysis of Variance on Ranks and Donn’s Method for all pairwise comparisons. *p<0.05.

