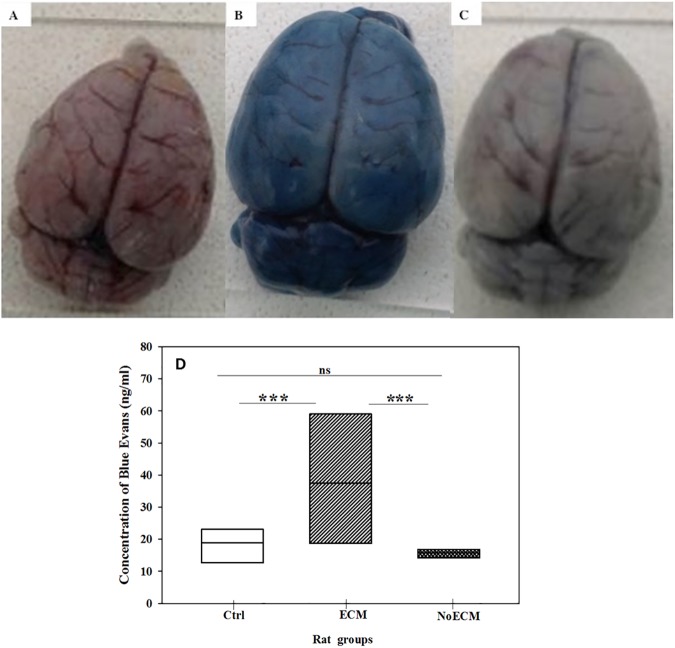
Fig 10. Assessment of brain vascular permeability.
(A) Dorsal view of brain from Control (Ctrl), (B) Dorsal view of brain from ECM, and (C) Dorsal view of brain from NoECM rats after injection of Evans blue dye in tail vessel and sacrifice 90 minutes later. (D) Quantification of Evans blue dye concentration in brain of non-infected (Control; n = 7) and infected rats (ECM; n = 5 or NoECM; n = 8). After Evans blue dye injection, brain was removed and immersed in a 2 ml of paraformaldehyde (PFA) for 48h at 37°C. The extravasated dye was quantified by spectrophotometer. Box plots represent medians and 25th and 75th percentiles. Statistical test used: Kruskal-Wallis One Way Analysis of Variance on Ranks and Donn’s Method for all pairwise comparisons. *p<0.05; **p<0.005; ***p<0.001.

