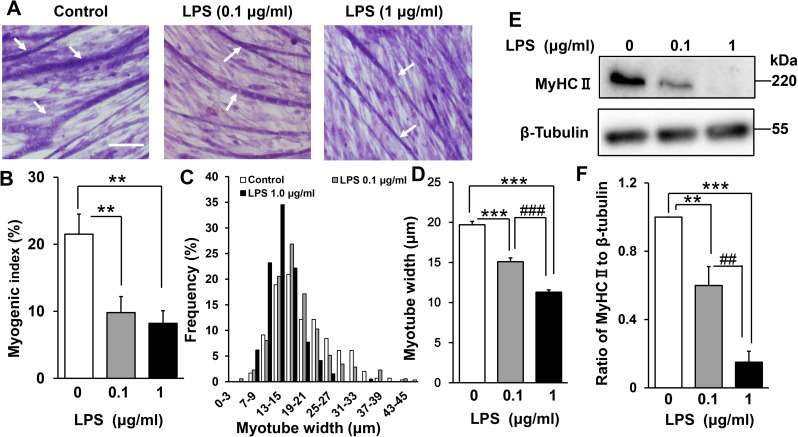
Fig 2. Effect of LPS on C2C12 myogenesis.
(A) LPS inhibits the formation of myotubes. Myoblasts were cultured for 144 h in DM alone (control), DM plus LPS 0.1 μg/mL, or DM plus LPS 1 μg/mL, then fixed and subjected to May–Grünwald–Giemsa staining. Representative images are shown. Scale bar = 100 μm. Arrows indicate differentiated myotubes. (B) LPS decreases the myogenic index. Cells were treated as described in (A). Data are the mean ± SEM of 10–12 independent experiments, each examining 5 randomly selected fields (total 50–60 fields per treatment group). (C and D) LPS induces myotube atrophy. Cells were treated as described in (A), and the distribution of myotube widths (C) and mean myotube widths (D) were calculated. Data are the mean ± SEM of 10–12 independent experiments, each examining 5 randomly selected fields (total 175–296 myotubes from 50–60 fields per treatment group). (E) Representative western blot probed with antibodies to MyHC II or β-tubulin (internal standard). Cells were treated as described in (A). (F) Quantification of the data presented in (E). Data are the mean ± SEM of 13–14 independent experiments. ***p < 0.001, **p < 0.01, ###p < 0.001, ##p < 0.01 by one-way ANOVA followed by Tukey’s honest significant difference test.

