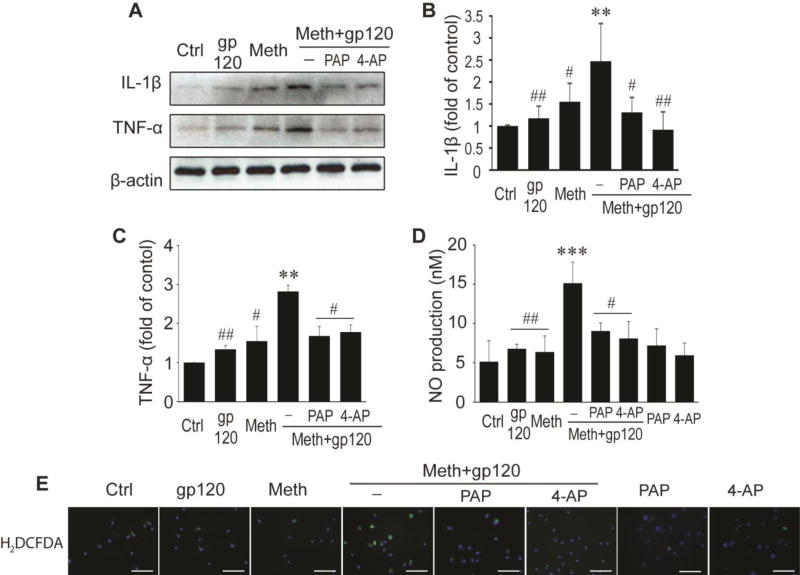
Fig. 3. Blockage of KV1.3 channel mitigates neurotoxins secreted by Meth/gp120-activated microglia.
A. Western blots show expression of IL-1β, TNF-α, and internal control β-actin. B and C. Increased folds of IL-1β and TNF-α are illustrated on bar graphs. D. Graph shows NO production. E. Immunostaining reveals expression of H2DCFDA, a ROS detection reagent. Images were visualized by fluorescent microscopy at x40 original magnification. Scale bar equals 100 µm. **p < 0.01, or ***p < 0.001 vs ctrl; #p < 0.05, or ##p < 0.01 vs Meth+gp120. Data represent the mean ± SD in three independent experiments.

