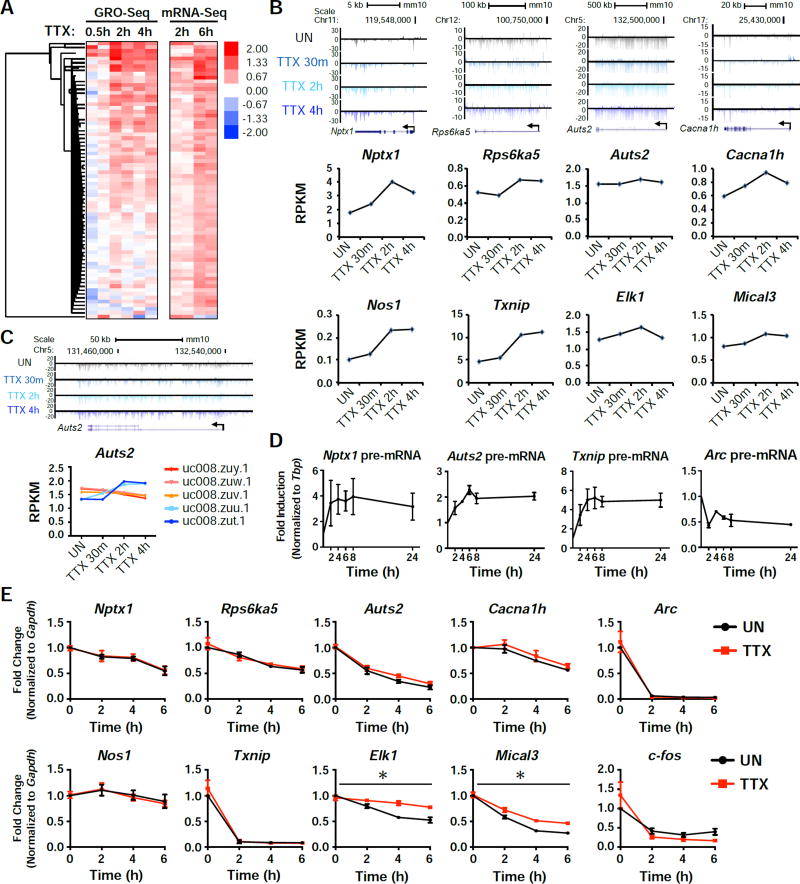
Figure 2. GRO-Seq confirms an active transcription program in response to activity-suppression.
(A) Heatmap of the 73 TTX-upregulated genes identified by mRNA-seq, showing their expression normalized to unstimulated. Each time point shows the data of two biological replicates. (B) Genome browser views showing the global nuclear run-on sequencing (GRO-Seq) tracks aligned with 4 of the candidate genes in response to 30 min, 2h, or 4h TTX treatment. Below the tracks are graphs displaying the RPKM values for each condition. (C) A genome browser view of the shorter isoforms of Auts2 (top), along with isoform specific RPKM values for the indicated time points (bottom). (D) qRT-PCR results from cells that were treated with TTX for the indicated time points. pre-mRNA levels were measured for the indicated genes. n = 3 biological replicates. (E) RNA levels of the indicated genes after treatment with Actinomycin D (Act D) for the indicated time points, with or without a 15 min pretreatment with TTX. n = 3 biological replicates. Error bars represent SEM. *, p<0.05. p values were determined by a two-way ANOVA.

