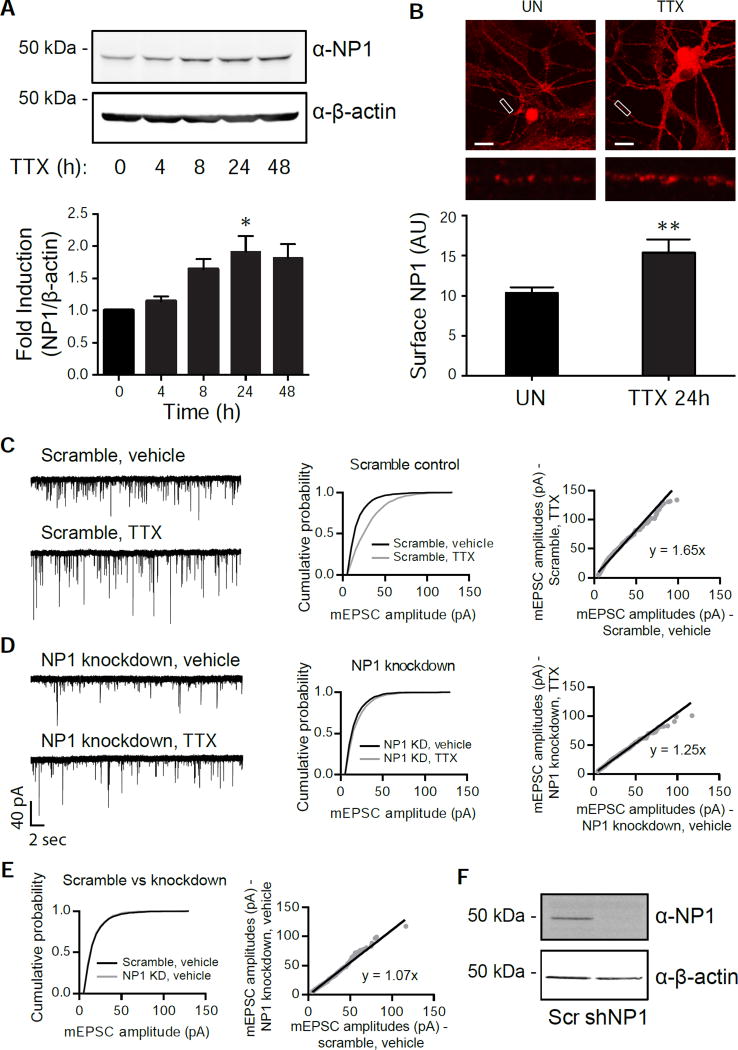
Figure 3. Nptx1 is functionally important for homeostatic scaling.
(A) Western blot of NP1 and β-actin expression in cortical neurons that were treated with TTX for the indicated time points (top) and the quantification of the induction (Bottom). n = 3 biological replicates. (B) Staining of surface NP1 levels on neuronal dendrites in unstimulated (UN) or TTX treated (24h) conditions, with the quantification below. n = 13 and 15 dendrites for UN and TTX conditions, respectively. (C,D) Example traces, cumulative probability histograms, and rank order plots of AMPA-mediated mEPSC amplitudes from cells treated with either vehicle or TTX after infection with the scrambled control (C) or NP1 knockdown (D). Scramble vehicle (n = 9) vs Scramble TTX (n = 8) p = 1.5×10−74, D = 0.31. Knockdown vehicle (n = 7) vs Knockdown TTX (n = 8) p = 7.3×10⁻⁵, D = 0.08. (E) The cumulative probability histograms from vehicle-treated conditions of either the scrambled or knockdown cells from (C) and (D) overlaid. p = 0.03, D = 0.17. See also Figure S3. (F) Representative western blot of the efficiency of NP1 knockdown in the scaling experiments. *, p < 0.05; **, p < 0.01. p values determined by an unpaired Student’s t-test. Statistical significance between cumulative probability graphs was determined by the Kolmogorov-Smirnov test. Error bars represent SEM.

