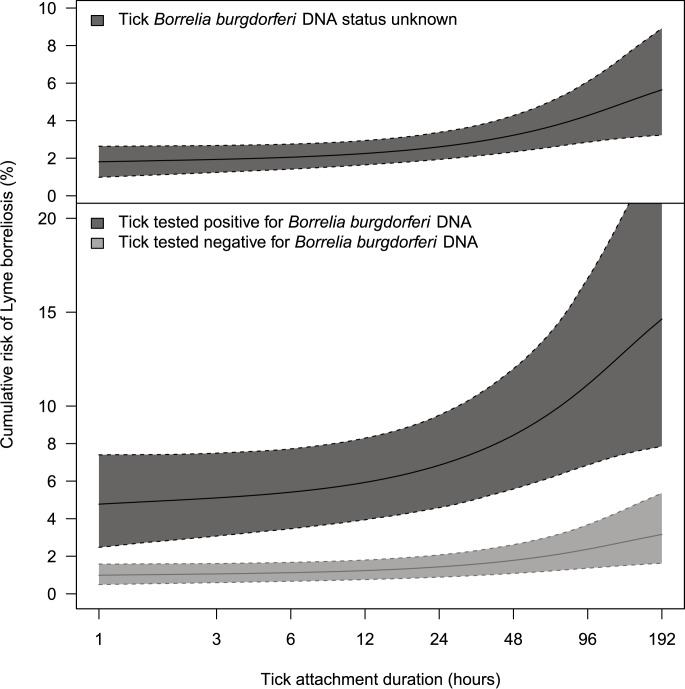
Fig 3. Probability of developing Lyme borreliosis after a single tick bite, as a function of patient-estimated duration of tick attachment.
The solid line represents the mean, the dotted lines the 95% credible interval. Also see Table 1 and S3 Table. Upper graph: ignoring all other variables in our model. Lower graph: stratified for tick infection with Borrelia burgdorferi s.l. DNA, tested by PCR. Ignoring tick stage, engorgement, and age of the participant.

