
Fig. 3.
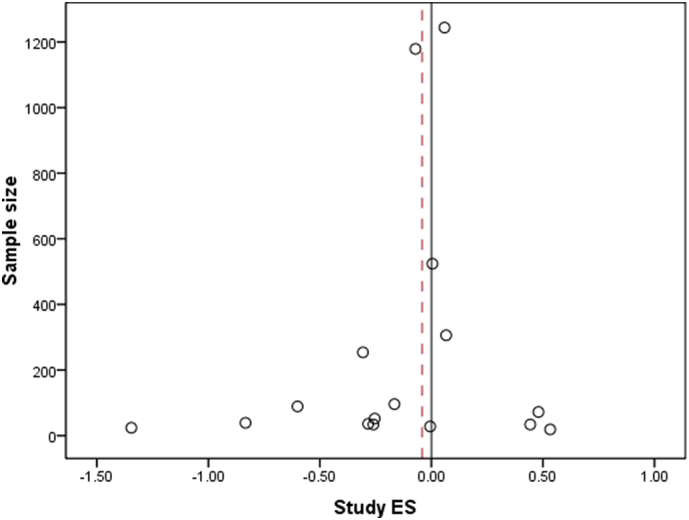
Funnel plot of the study effect sizes (ES) and corresponding sample sizes, with the black line indicating x = 0 and the dotted line indicating the grand mean ES = − 0.041. Note that the largest studies with sample size N > 200 all approach the same ES close to 0, suggesting that a sample size of 300 and larger is required to obtain stable and biologically plausible effects for FAA in MDD.