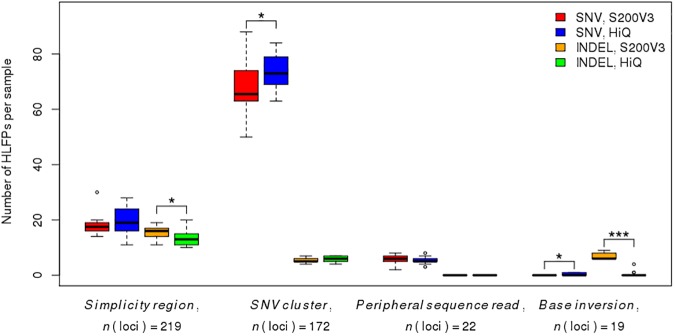
Fig 5. Comparison of sequencing kit-specific effects between S200V3 and HiQ among four variant-calling error types.
Box plots of the numbers of HLFP variants per sample in kit groups with SNV and INDEL, respectively. Upper and lower box hinges show the 25th and 75th percentile; whiskers extend from hinges is the maximum and minimum values within 1.5 times the interquartile range (IQR); the median is represented by a horizontal bar in the box. *P < 0.05, ***P < 0.001 by Student’s t-test.

