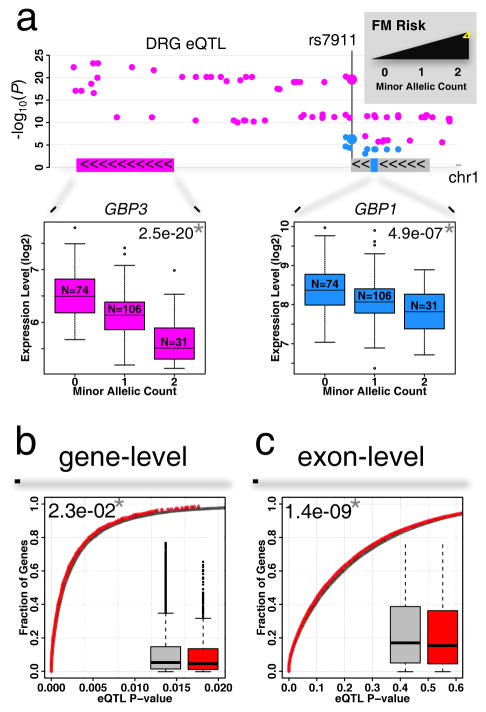
Figure 5.
Contribution of DRG eQTLs to gene-candidates association results with pain phenotypes. (a) Manhattan plot of DRG eQTLs in the GBP genes cluster. The minor allele for SNP rs7911 has been previously associated with increased risk for FM. The same SNP is also an eQTL at gene-level for GBP3 (magenta), and at exon-level for GBP1 (blue). Color-coded insets show gene and exon expression level change as a function of minor allele count. A star (*) indicates statistical significance for reported P-values. (b) Cumulative distribution function of cis-eQTL P-values for all genes (grey) is compared with that of reported pain genes (red) at gene-level or (c) at exon-level. Box-and-whisker plots show difference in P-value distributions. See also Tables S5 and S6.

