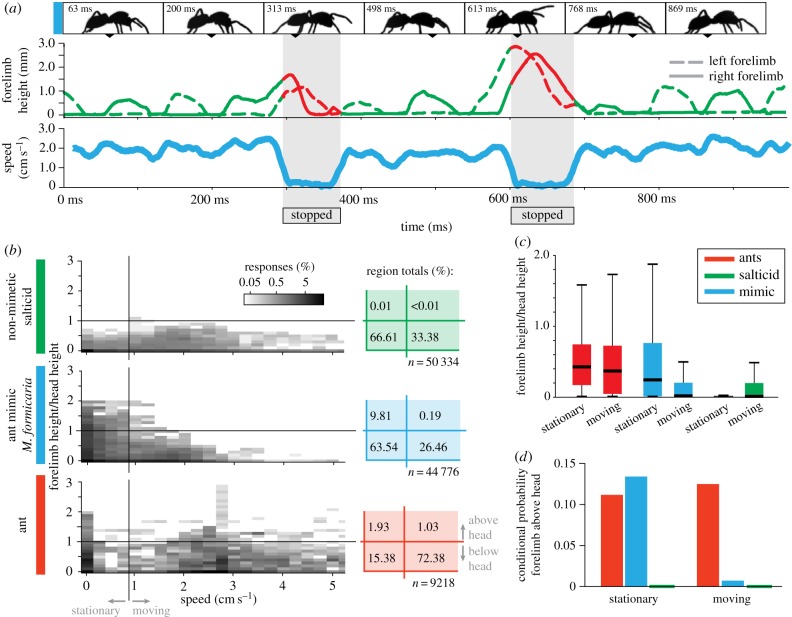
Figure 2.
Forelimb height during locomotion. (a, top) High-speed video frames showing M. formicaria walking; elevated forelegs can be seen in the third and fifth images when the animal was stationary. (a, bottom) Foreleg height and animal speed for a single trial. When walking, forelegs move in anti-phase (green). When stopped, the forelegs are raised and move in-phase (red). Grey area highlights when the animal was stationary. (b) Probability density maps (log scale) for observing an animal with a given forelimb height and walking at a given speed (cut-off at 52 cm s−1 for clarity), over multiple high-speed videos (see Material and methods). Ant antennae were considered as forelimbs. Forelimb height is normalized by animal head height. Stationary/moving division set to less than 1 cm s−1. Total probabilities for the four regions (stationary/moving, limb above/below head height), shown at right highlighting mimic foreleg elevation when stationary. (c) Boxplot showing relative forelimb height for animals while stationary or moving. Centre lines denote medians, boxes extend to 25th and 75th percentiles, and whiskers to 99th percentiles of a normal distribution. Outliers beyond this range were excluded for clarity. All groups are significantly different from one another (Kruskal–Wallis;  ; p < 0.001 after Bonferroni correction). (d) Conditional probability that forelimbs are above head height given an animal is either stationary or moving. Salticid values (green) are shown as a line with weight for visibility—both values are positive but <0.001.

