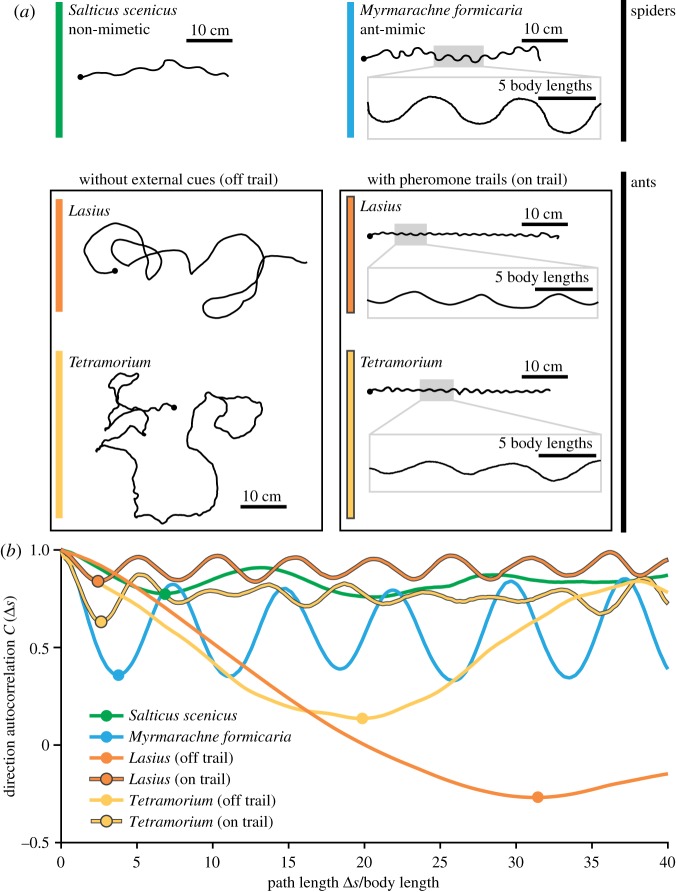
Figure 3.
Overall trajectory analysis. (a) Example traces of paths walked by a non-mimetic jumping spider (S. scenicus), an ant mimic (M. formicaria) and two ant species. All spiders were tracked moving across a featureless arena; ants were on a featureless arena or following a pheromone trail. Black dots mark the starting position of each trajectory. Grey boxes show a portion of the trail at higher magnification. (b) Direction autocorrelation C(Δs) for each example shown in (a). Circles on each line mark the first autocorrelation minimum, C(Δsmin).

