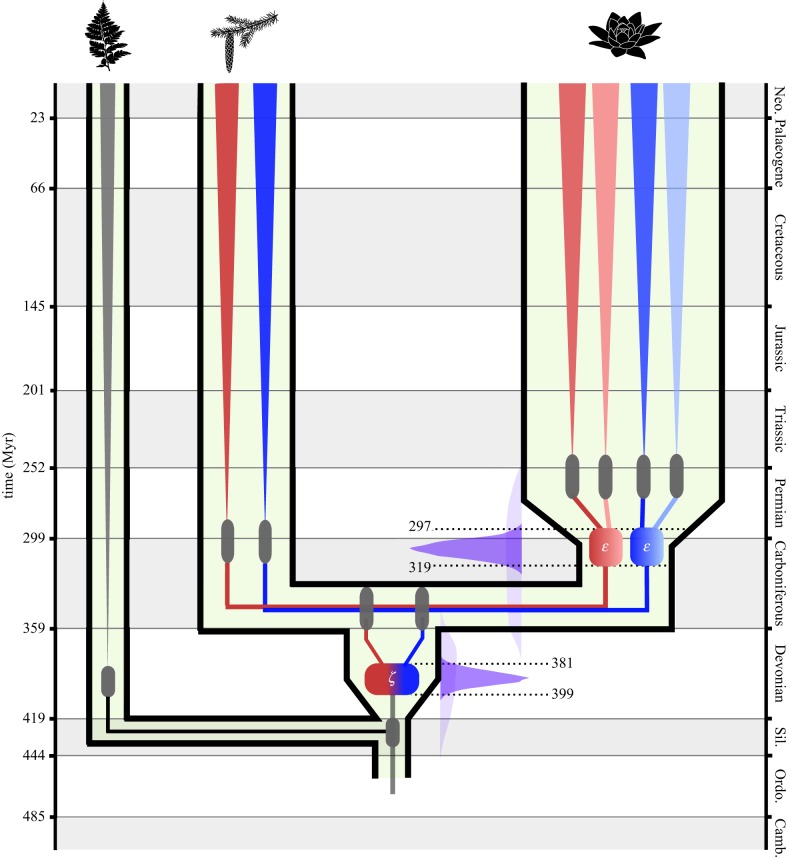
Figure 2.
Estimated dates for the occurrence of both the seed plant (ζ) and angiosperm (ɛ) duplication events based on a molecular clock analysis of 33 concatenated gene families. Age estimates (95% HPD) for the divergences of the major lineages and crown groups represented by grey bars. The age estimates (95% HPD) of two duplication events are represented by coloured boxes, with the subsequent subgenomes represented first by blue and red (ζ), then by lighter and darker shades of each colour (ɛ). For each duplication event, the effective prior is shown (light blue) next to the posterior distribution (dark blue). (Online version in colour.)

