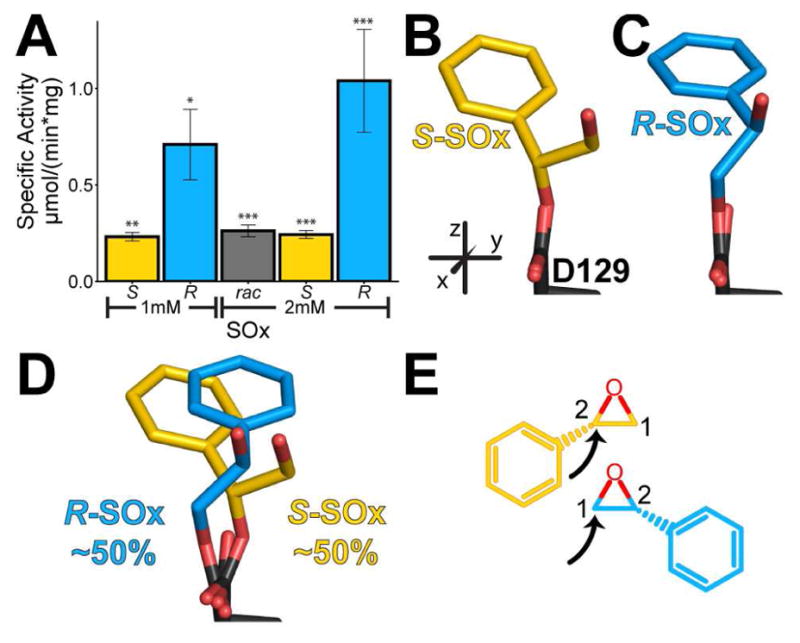
Figure 3. Hydrolysis and trapped intermediates of SOx.

A. Specific activity of Cif for SOx enantiomers. B, C. View of intermediates in the crystal structures with S-SOx (yellow carbons) and R-SOx (blue carbons), respectively. D. View of intermediates in the crystal structures with rac-SOx. E. Chemical diagrams of the proposed carbons attacked by Cif based on the crystal structures. The black arrows indicate the carbon attacked by Asp129. Mean ± S.D.; *, p < 0.05; **, p < 0.01; ***, p < 0.001. See also Table S1 and Figures S3, S4, and S5.
