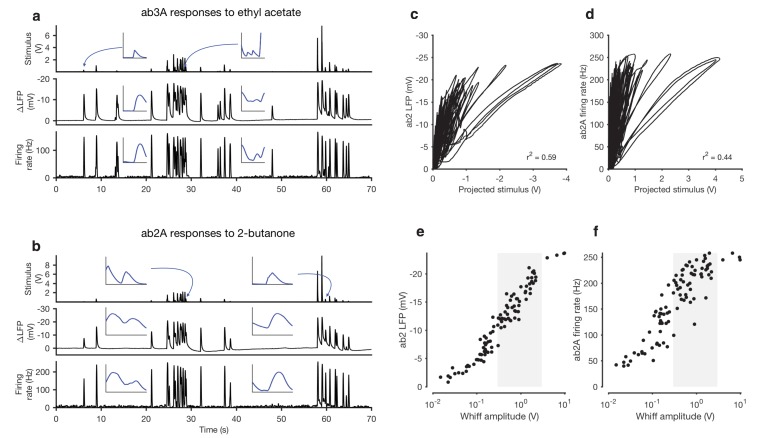
Figure 1. Adaptation and saturation modulate ORN responses to broadly distributed naturalistic stimuli.
(a) Ethyl acetate odorant (top) elicits LFP (middle) and firing rate (bottom) responses from a ab3A ORN. (b) 2-butanone odorant (top) elicits LFP (middle) and firing rate (bottom) responses from a ab2A ORN. Insets in (a–b) show pairs of whiffs and the LFP and firing rate responses they elicit on an expanded timescale. All pairs of insets are shown at the same scale, for 400 ms around a whiff. (c) ab2 LFP responses vs. projected stimulus. (d) ab2A firing rate vs. projected stimulus. (c) and (d) show that ORN responses differ significantly from linearity. (e) ab2 LFP responses vs. whiff amplitude. (f) ab2A firing rate vs. whiff amplitude. n = 15 trials from 2 ORNs. 101 whiffs shown in (e–f).


