. 2017 Jun 27;6:e27670. doi: 10.7554/eLife.27670

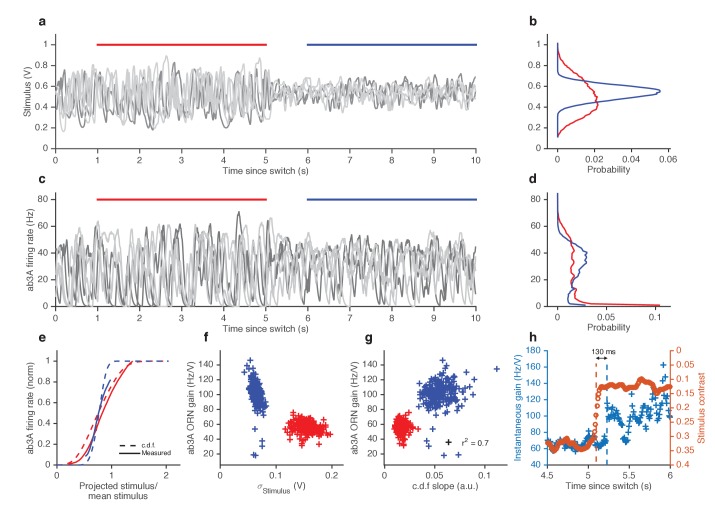
Figure 4. ORNs decrease gain with stimulus variance.

(a). Stimulus intensity of a fluctuating ethyl acetate stimulus with nearly constant mean but a variance that switches between high and low every 5 s. Five independent trials (out of 248) are plotted. (b) Distributions of stimulus intensity for the epochs of low (blue) and high (red) variance. (c) ab3A firing rate responses corresponding to the trials shown in (a) following the switch from low to high variance, which takes place at t = 0 s and from high to low, which takes place at t = 5 s. (d) Probability distributions of the response. (e) Solid lines are ORN input-output curves computed from a single filter from both low (blue) and high (red) variance epochs. Dashed lines are the cumulative distribution functions (c.d.fs) of the projected stimulus. (f) ORN gain as a function of the standard deviation of the stimulus, measured per trial for each epoch. (g) Measured gain plotted against the slope of the cumulative distribution function for each trial. (h) Instantaneous gain (blue) and stimulus contrast (orange) as a function of time since switch. Dashed lines indicate crossover times of stimulus contrast and instantaneous gain. The delay is ~130 ms. n = 248 trials from 5 ab3A ORNs in 2 flies.

DOI: http://dx.doi.org/10.7554/eLife.27670.014

Figure 4.

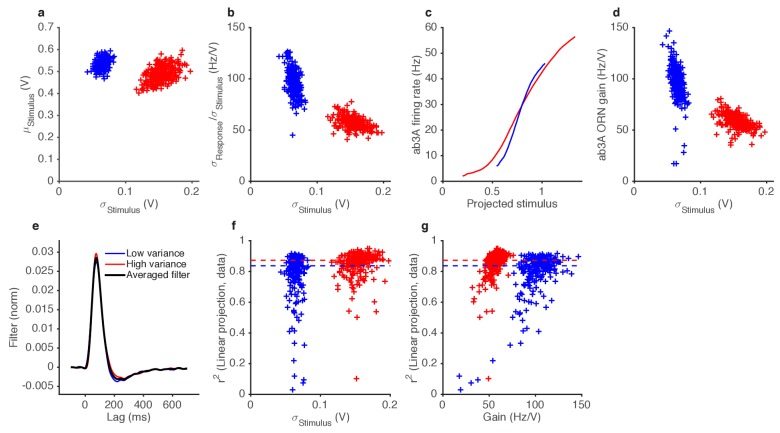
Figure 4—figure supplement 1. Variance gain control in Gaussian stimuli.

Figure 4—figure supplement 1.

(a) While the dominant change between the two epochs is the change in variance (by construction), the low variance trials also tend to have slightly higher means. (b) ORN gain estimated by dividing the standard deviation of the response by the standard deviation of the stimulus, for each trial, vs. the standard deviation of the stimulus (cf. Figure 4f). (c) Input-output curves for the ab3A ORN uncorrected for the change in the mean stimulus. The blue curve intersects the red curve, and is steeper than the red curve, suggesting that gain during the low variance epoch is higher than the gain during the low variance epoch. (d) ORN gain during high and low variance epochs, without correcting for the change in the mean stimulus. Each trial appears in the plot as one blue point (for the low variance epoch) and one red point (for the high variance epoch). (e) Filters used in this analysis. Filters backed out of low variance (blue) or high variance (red) epochs alone are very similar. Therefore, we averaged all filters (black) and used that averaged filter to project all the stimulus in this dataset. (f) Coefficient of determination (r2) vs. the standard deviation of the stimulus.~80% of trials had r2>0.8. (g) Coefficient of determination (r2) vs. trial-wise ORN gain in the high and low variance epoch. Dashed lines in (f–g) indicate the median r2 during the high and low variance epoch.