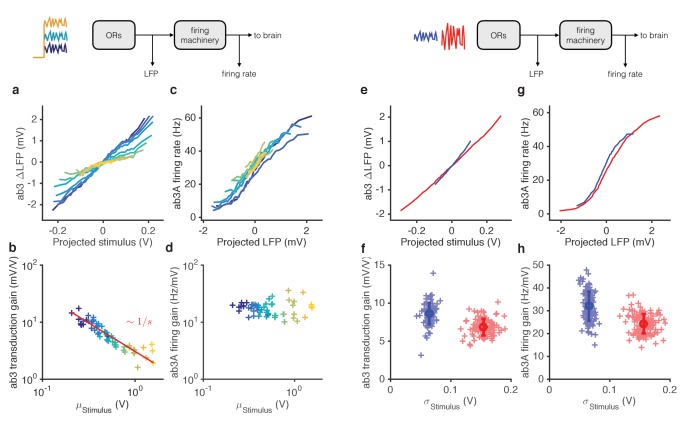
Figure 5. Mean gain control occurs primarily at transduction, and variance gain control occurs both at transduction and at the firing machinery.
(a) Transduction input-output curves from stimulus to LFP. Colors indicate increasing mean stimulus. Filters and projections are computed trial by trial. (b) Transduction gain, measured from the slopes of these input-output curves, decreases with the mean stimulus. The red line is a power law with exponent −1, (Weber’s Law). (c) Input-output curves for the firing machine module. (d) Firing gain does not change significantly with mean stimulus. (e) Transduction input-output curves for low (blue) and high (red) variance stimuli. (f) Transduction gains in the low variance epoch are significantly higher than transduction gains in the high variance epoch (p<0.001, Wilcoxon signed rank test) (g) Input-output curves of firing machinery during low variance stimuli. (g) Firing gain during low variance epochs are significantly higher than firing gains during high variance epochs (p<0.001, Wilcoxon signed rank test). Projections of stimulus are divided by the mean stimulus in each trial to remove the small effect Weber-Fechner gain scaling. Data in this figure is same as in Figures 3 and 4. (a,c,e,g) Mean across all trials. (b,d,f,h) Individual trials.


