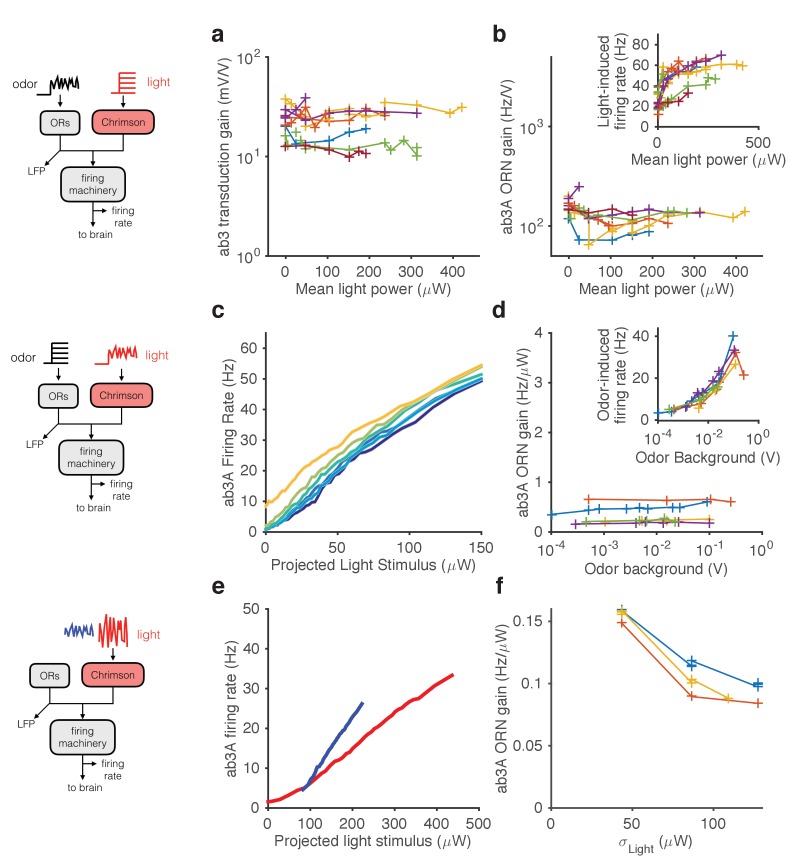
Figure 6. Modularity of gain control revealed by optogenetic stimulation.
ab3A ORNs in w; 22a-GAL4/+; UAS-Chrimson/+ flies can be activated by ethyl acetate odorant or by red light. (a–b) Fluctuating odor foreground and constant light background. (a) Transduction gain to fluctuating odor vs. background light stimulation intensity. (b) Overall ORN gain to fluctuating odor stimulus vs. background light stimulation intensity. (b, inset) ORN firing rate vs. background light intensity. (c–d) Fluctuating light foreground and constant odor background stimulus. (c) Input-output curves to fluctuating light stimulus for increasing background odor (lighter colors indicate larger odor background). (d) ORN gain is invariant with background odor concentration. (d, inset) Odor-induced firing gain vs. background odor concentration. (e–f) Fluctuating light stimulus with different variances. (e) Input-output curves for high (red) and low (blue) variance light stimuli. (f) ORN gain as a function of the standard deviation of the light stimulus. (a–b) n = 75 trials from 13 ORNs. (c–d) n = 64 trials from 5 ORNs. (e–f) n = 21 trials from 3 ORNs. Lines link trials from a single ORN.

