. 2017 Jun 27;6:e27670. doi: 10.7554/eLife.27670

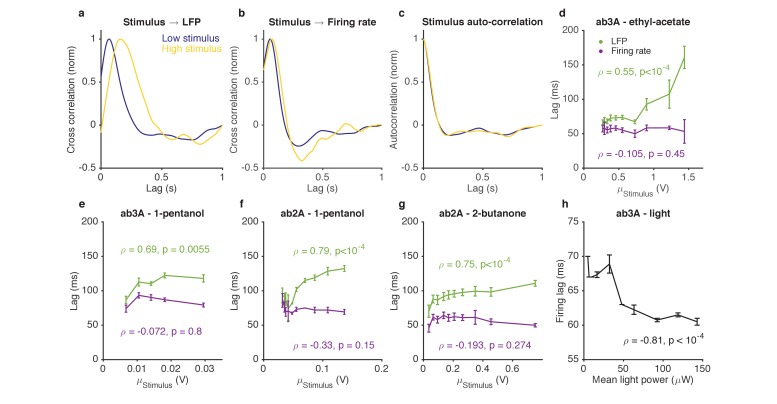
Figure 7. Adaptation to the mean slows down LFP, but not firing rate.

(a–d). Response of ab3A ORNs to Gaussian ethyl acetate stimuli on increasing backgrounds. (a) Cross correlation functions between ethyl acetate stimulus and ab3 LFP responses for low (purple) and high (yellow) background stimuli. (b) Cross correlation functions between ethyl acetate stimulus and ab3A firing rate responses for low (purple) and high (yellow) background stimuli. (c) Stimulus autocorrelation functions for low (purple) and high (yellow) background stimuli. (d–g) LFP and firing rate lags with respect to the stimulus vs. the mean stimulus for various odor-receptor combinations. LFP lags increase with mean stimulus, while firing rate lags do not. (h) Firing lags of ab3A ORNs expressing Chrimson channels vs. applied light power. In (c–g), ρ is the Spearman correlation coefficient, and p is the corresponding p-value.

DOI: http://dx.doi.org/10.7554/eLife.27670.019

Figure 7.

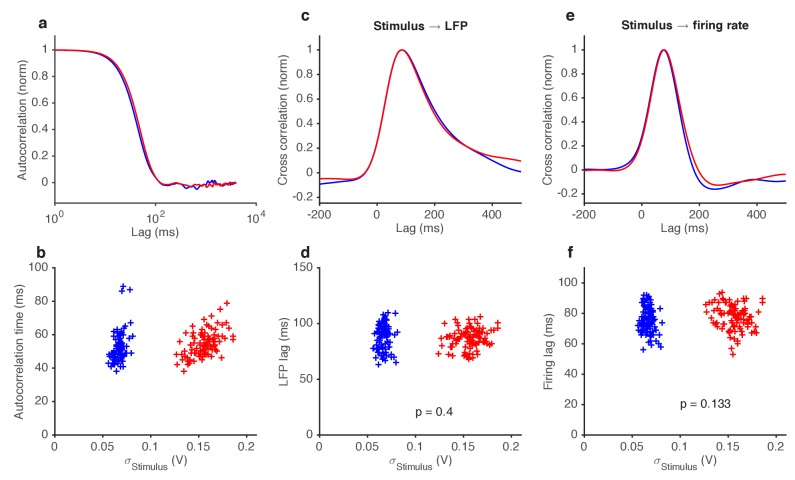
Figure 7—figure supplement 1. Variance gain control does not change response kinetics.

Figure 7—figure supplement 1.

(a) Stimulus autocorrelation functions, computed during high variance epochs (red) and during low variance epochs (blue). (b) Autocorrelation time (defined as the time the autocorrelation function first drops to 1/e) vs. the standard deviation of the stimulus, for each trial. (c) Cross correlation functions from stimulus to LFP. The cross correlation functions are very similar between high (red) and low (blue) variance epochs. (d) LFP lag with respect to the stimulus, estimated from the location of the peak cross-correlation, vs. standard deviation of the stimulus. No significant change in lag was observed (p=0.4, t-test). (e) Cross correlation functions from stimulus to firing rate. The cross correlation functions are very similar between high (red) and low (blue) variance epochs. (f) Firing rate lag with respect to the stimulus, estimated from the location of the peak cross-correlation, vs. standard deviation of the stimulus. No significant change in lag was observed (p=0.133, t-test).