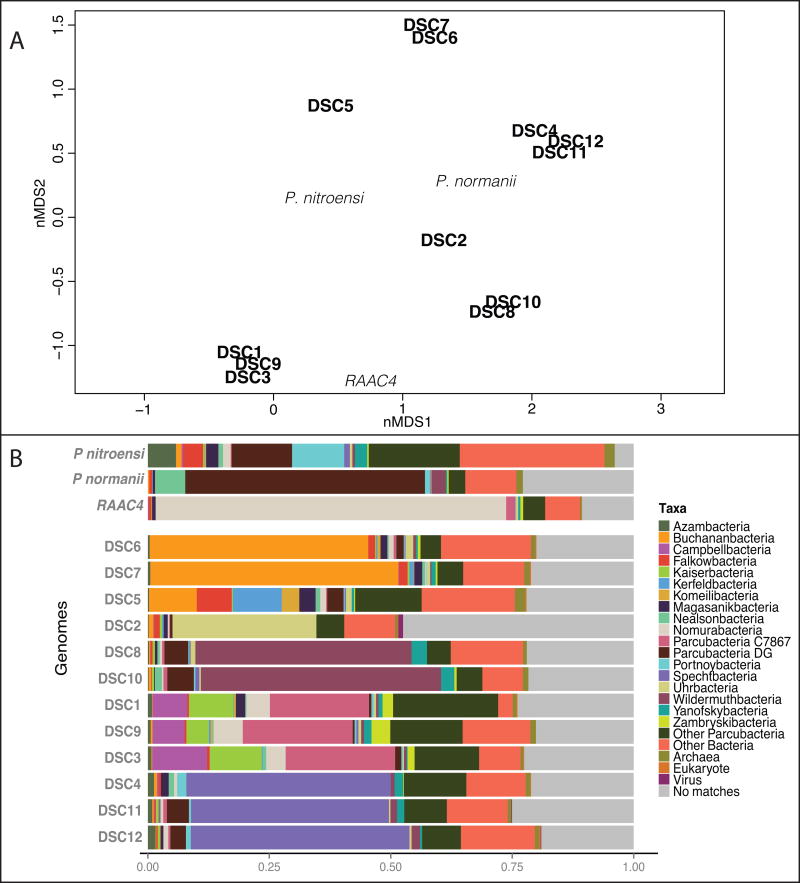
Figure 2. Taxonomic classification of annotated protein within the Parcubacteria superphylum.
A) Non-metric multidimensional scaling (nMDS) of the taxonomic classification of annotated proteins within the Parcubacteria superphylum were generated from the DarkHorse analysis. DSC protein annotated as Parcubacteria per SAG range from 67% (DSC5) to 88% (DSC10) of the total of protein in the genomes. DSC genomes (in bold black) and comparison genomes (in light black; Kantor et al., 2013, Brown et al 2015, Castalle et al, 2017) are ordinated in the 2D plot. Based on protein classifications the DSC Parcubacteria reinforces the 16S data, as they group similarly when looking the taxonomic classifications. Stress value = 0.01183975. B) Bar plot shows the distribution of Parcubacteria taxa in SAGs. Parcubacteria taxa shown make up 5% or more than the total protein matches and include proteins identified as archaeal, viral, non-Parcubacteria bacterial matches and un-assigned proteins

