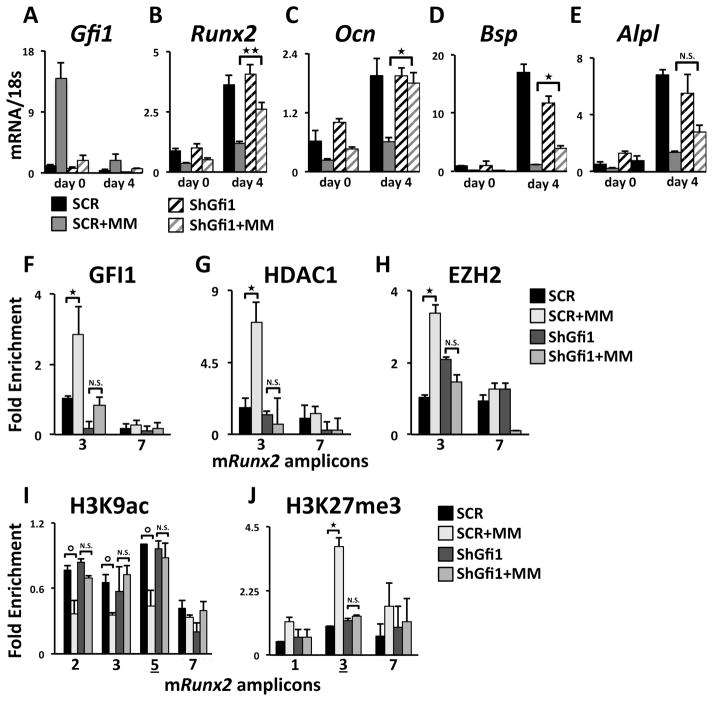
Figure 4. mGfi1 knockdown in MC4 cells prevents MM-induced repression of mRunx2 and OB differentiation markers, the recruitment of HDAC1 and EZH2, and repressed chromatin architecture acquisition.
qPCR analysis of mRNAs from SCR- and shGfi1-MC4 cells treated as described in Fig. 1A for: (A) Gfi1, (B) Runx2, (C) Ocn, (D) Bsp, and (E) Alpl mRNA expression. ChIP-qPCR analyses of MM-induced recruitment to the Runx2 promoter of (F) GFI1, (G) HDAC1, and (H) EZH2 and enrichment profiles for (I) H3K9ac and (J) H3K27me3 in SCR and shGfi1-MC4 at d0±MM. IgG ChIP was run on SCR-MC4 cells. Error bars represent SEM for (A–E) 3–4 or (F–J) 2 biological replicates ⭘ – represents values of p<0.08. Amplicons as indicated in Fig 1B.

